Live Risk Dashboards for Real Estate Portfolios
Track the book live against the limits and benchmarks the board governs to, get an alert while there is still time to act, and define the dashboard once so each risk review is a refresh, not a rebuild. Quanthome tracks portfolio positions live against the risk limits and benchmarks the board governs to, from gearing and vacancy to concentration and energy exposure, with a qualitative overlay that records why a figure moved. Alerts fire when a threshold is approached or crossed, while there is still time to act. A dashboard is defined once and stays on current data, so each review is a refresh rather than a rebuild.
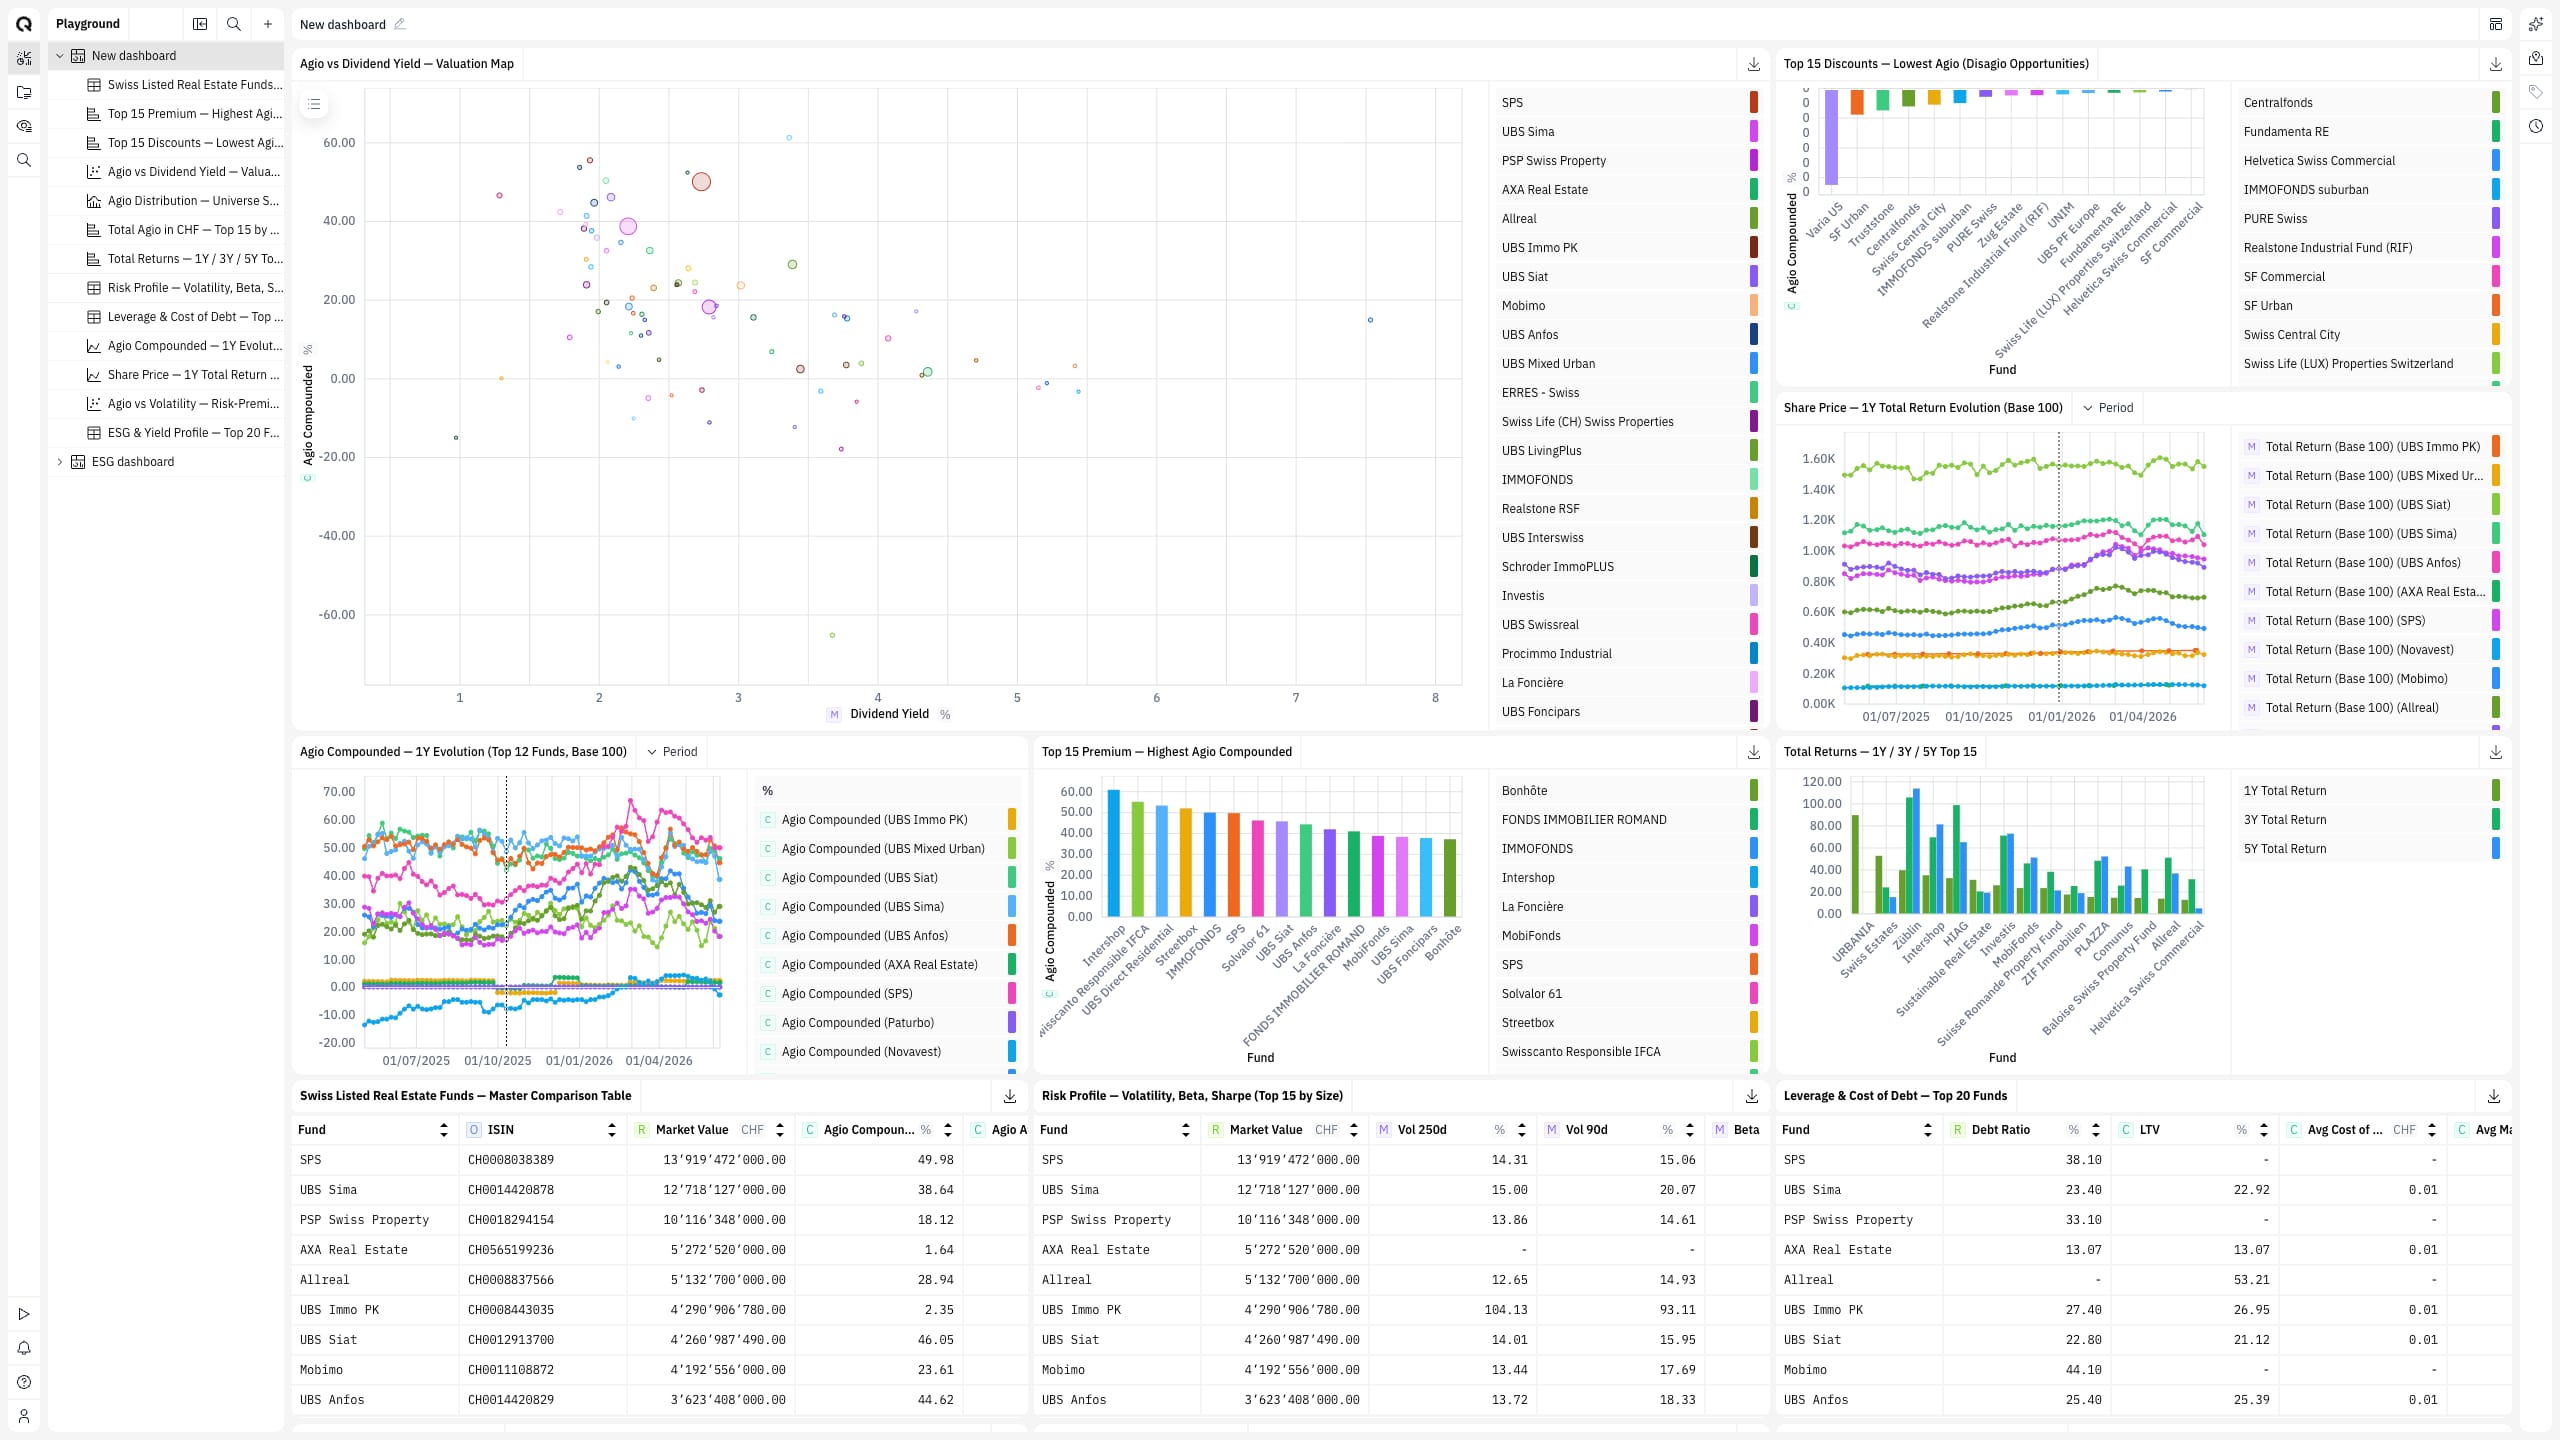
See the exposure while there is still time to act.
Watch the whole book live
Track gearing, vacancy, concentration and energy exposure against the limits the board governs to on one maintained base, not on a quarterly pack that is stale before the meeting.
Stop assembling the pack
Positions are measured against their limits continuously and the analyst's note sits beside each figure, so no one re-keys a snapshot or reconstructs why a number moved after the fact.
Refresh, never rebuild
A dashboard defined once reopens on current positions and alerts when a threshold is approached, moving the time from building the pack to acting on the exposure.
How risk managers see exposure while there's still time to act
Define the risk limits and benchmarks the board governs to, from gearing and vacancy to concentration and energy exposure. Any of the 400+ data fields per asset can carry a limit, a benchmark or an alert, so the next risk is not the one no one has dashboarded yet. Dynamic position data feeds the dashboard as it updates, rather than waiting for the quarterly pack.
Positions are measured against the limits and benchmarks continuously, not against last quarter's snapshot. When a threshold is approached or crossed, an alert fires while there is still time to act, before the risk reaches a quarterly pack. A qualitative overlay records the analyst's judgement next to each figure, so the dashboard carries why a number moved, not only that it did.
A dashboard carries its limits, its benchmarks, its alert thresholds and its overlay notes forward. The next risk review opens on current positions, not on the quarter that has already played out. Time moves from assembling the pack to acting on the exposure.
Built for
The Swiss real estate desks this job is built for.
Owners & operators
Quanthome gives direct asset owners and the property managers who run their buildings one consistent, building-level view, performance, tenancy, capex and risk, from the same data.
Asset allocators & indirect real estate investors
One view across your direct buildings and your indirect holdings, so reports and decisions land in hours, not weeks.
Service providers & valuers
Run the same repeatable process every cycle, on the regulator's timetable, from one structured Swiss dataset rather than a fresh round of data collection each time.
Explore further
Quanthome Platform
The analyst workbench for real estate.
Quanthome Data Engine
From scattered documents to one structured, audited view.
Quanthome AI
Page-on-demand dashboards, generated from a question.
API & MCP
Your tools, our data.
Quanthome Workflows
From structured data to finished deliverables.
See How Quanthome Supports Risk Monitoring
Risk limits in Swiss real estate portfolios: what boards actually govern to
From quarterly pack to live dashboard: closing the gap where exposure builds
The qualitative overlay: why a figure moved belongs next to the figure
What People Ask Before the First Alert
What is a live risk dashboard?
A live risk dashboard tracks portfolio positions against defined risk limits and benchmarks on data that updates continuously, rather than on a quarterly snapshot. In Quanthome it measures the book against limits such as gearing, vacancy, concentration and energy exposure, records analyst judgement beside each figure, and fires an alert when a threshold is approached or crossed.
Which limits and benchmarks can be tracked?
Any limit the board governs to. The dashboard draws on a structured base of 400+ data fields per asset, so gearing, vacancy, concentration, energy exposure or any other field on the base can carry a limit, a benchmark or an alert. Limits are defined to the mandate rather than chosen from a fixed menu.
How are limit breaches handled?
Positions are measured against their limits and benchmarks continuously, and an alert fires when a threshold is approached or crossed, while there is still time to act. The breach path runs from threshold to alert to action before the risk reaches a quarterly pack, and the qualitative overlay records what moved and why.
Can analyst judgement be included on the dashboard?
Yes. A qualitative overlay sits alongside the numbers, so context and judgement appear on the same dashboard as the metrics. The overlay records why a figure moved, not only that it did, which means a committee reads the number and its explanation together instead of reconstructing the story after the fact.
Does the dashboard need to be rebuilt for each review?
No. A dashboard is defined once and carries its limits, benchmarks, alert thresholds and overlay notes forward. The next risk review opens it on current positions rather than rebuilding a quarterly pack from scratch, so each review is a refresh, not a rebuild, and time moves from assembling data to acting on the exposure.
CHF 5T+ of Indexed Real-Estate Value. Limits Tracked Live. Alerts That Fire While There Is Still Time to Act.
Tell us the book and its risk limits. We will build the live dashboard with you in a working session.
Book a working session