Reporting automatisé pour l'immobilier : factsheets, rapports annuels et ESG
Le problème
Factsheets, rapports annuels, publications ESG : ils sont obligatoires, mais les produire ne crée aucune valeur. À chaque cycle, les équipes ressaisissent les mêmes chiffres d'un tableur à l'autre, reconstruisent les mêmes graphiques et réconcilient les mêmes tableaux à la main, course contre la montre. Puis, au trimestre suivant, tout recommence.
Ce que fait Quanthome
Quanthome automatise l'ensemble du processus de reporting sur une seule base structurée et des workflows d'IA sur mesure. Factsheets, rapports annuels et rapports ESG sont générés dans le modèle que vous maîtrisez, chaque chiffre citant sa source : une semaine de production devient une exécution de quelques minutes, les erreurs apparaissent à la génération, et le temps de l'équipe passe à l'analyse.
Le reporting obligatoire, sans le travail manuel.
Récupérez le calendrier de reporting
Le reporting est obligatoire mais ne crée aucune valeur, et pourtant il consomme des semaines à chaque cycle. Les workflows automatisés ramènent une semaine de production de factsheets et un mois d'assemblage de rapport annuel à une exécution de quelques minutes.
Faites confiance à chaque chiffre
Chaque chiffre est récupéré au moment de la génération et porte une référence à sa source : les chiffres se réconcilient par construction et les erreurs apparaissent à la génération, pas à l'audit ni après l'envoi d'un rapport.
Rafraîchir, jamais reconstruire
La base structurée et vos modèles persistent : chaque cycle se rouvre sur données actuelles plutôt que sur un document vierge, et le temps de l'équipe passe de la ressaisie des chiffres à l'analyse et au jugement qui comptent vraiment.
Comment les équipes de reporting produisent les rapports obligatoires en quelques minutes
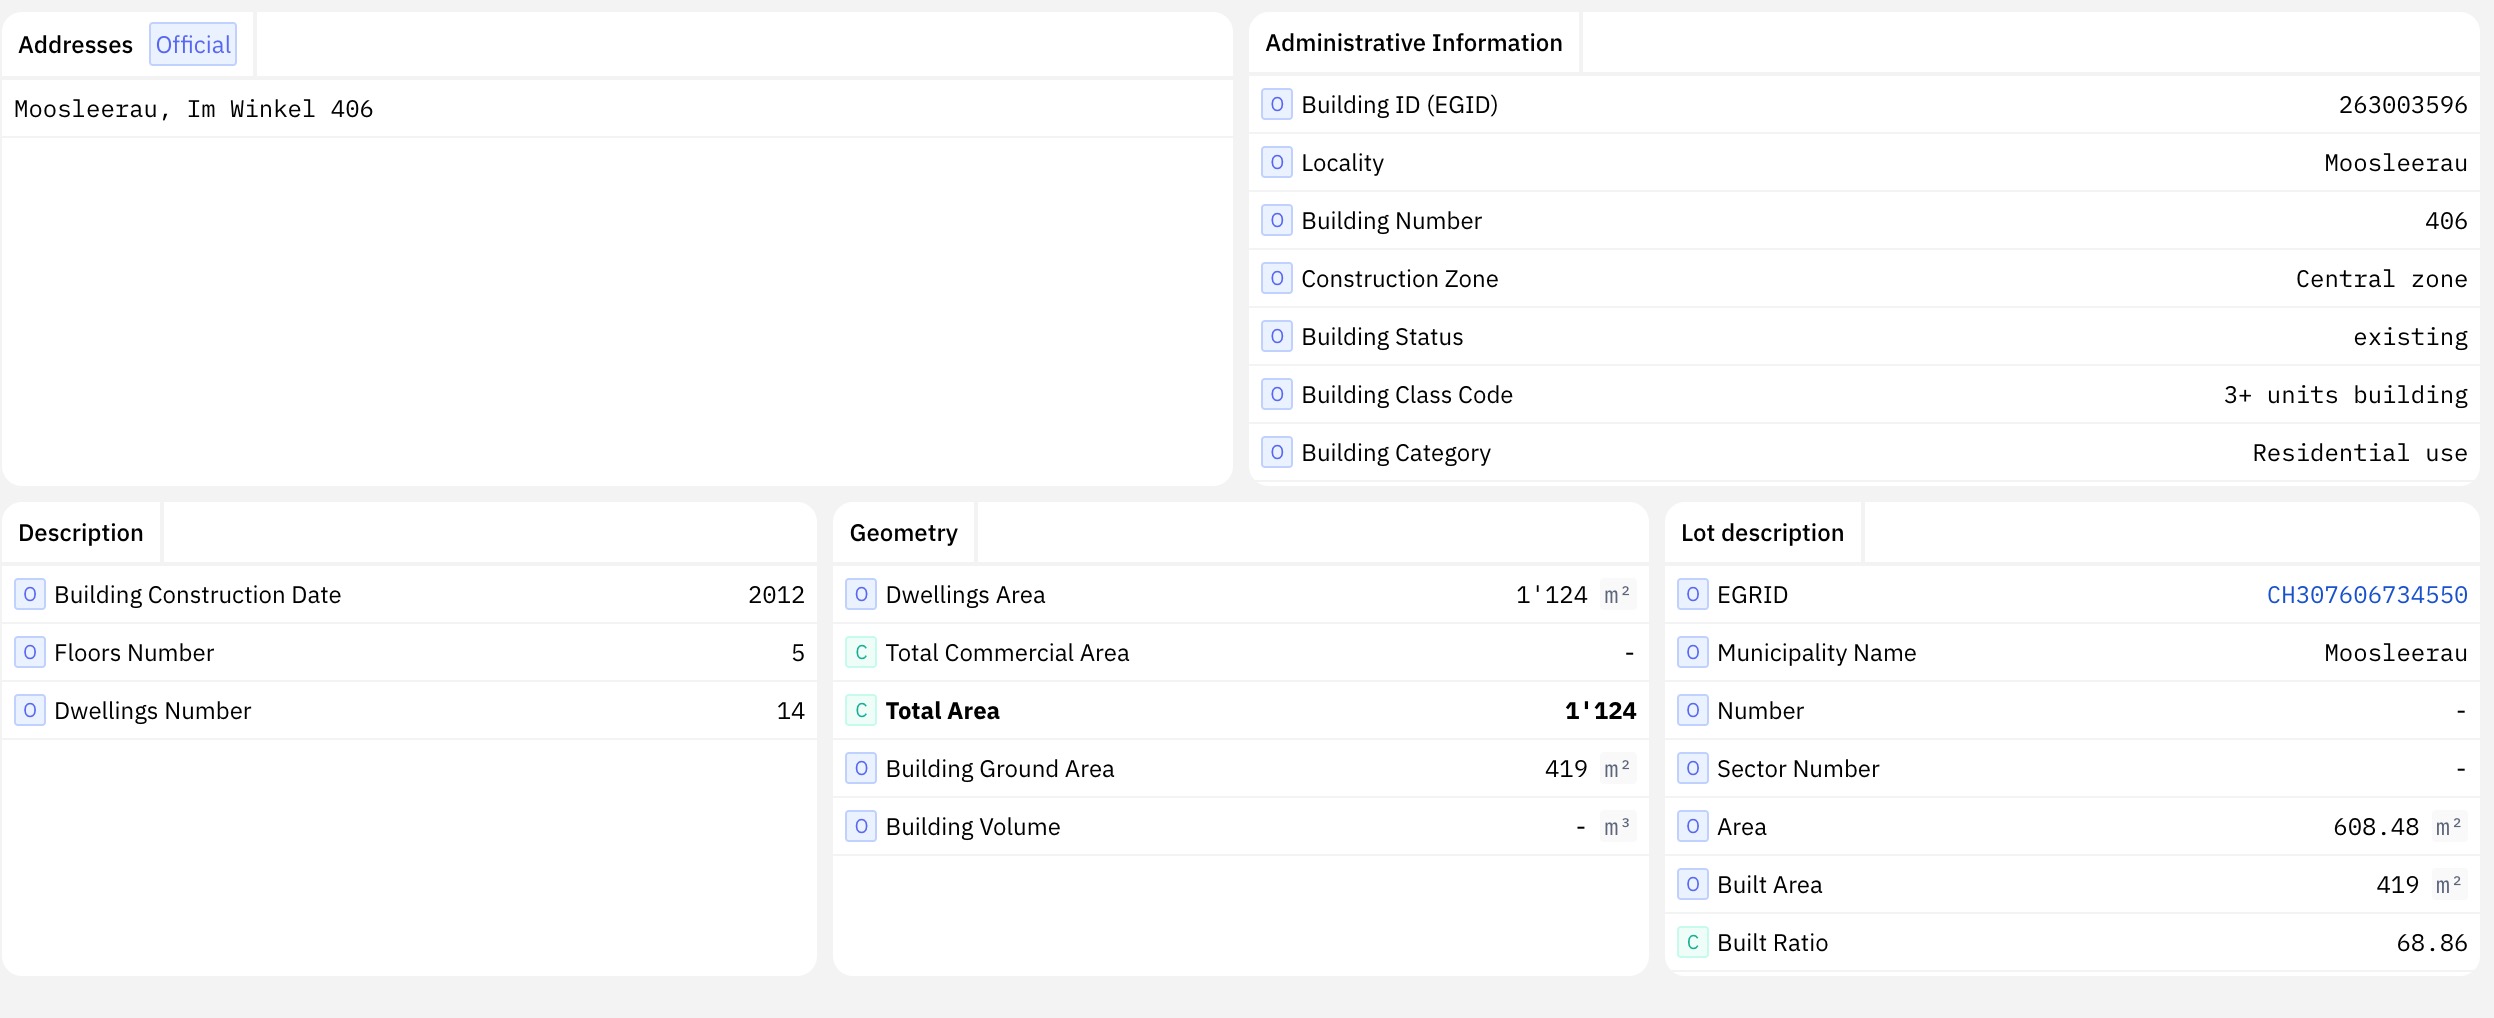
Le Data Engine récupère les chiffres de fonds, d'immeubles, financiers et ESG depuis les PDF, les exports et les publications de véhicules dans une seule base structurée, appariée par entity matching et reliée à sa source. Des documents épars qui n'ont jamais été conçus pour s'aligner deviennent des champs cohérents : le reporting part d'une base maintenue plutôt que d'un sprint de collecte.
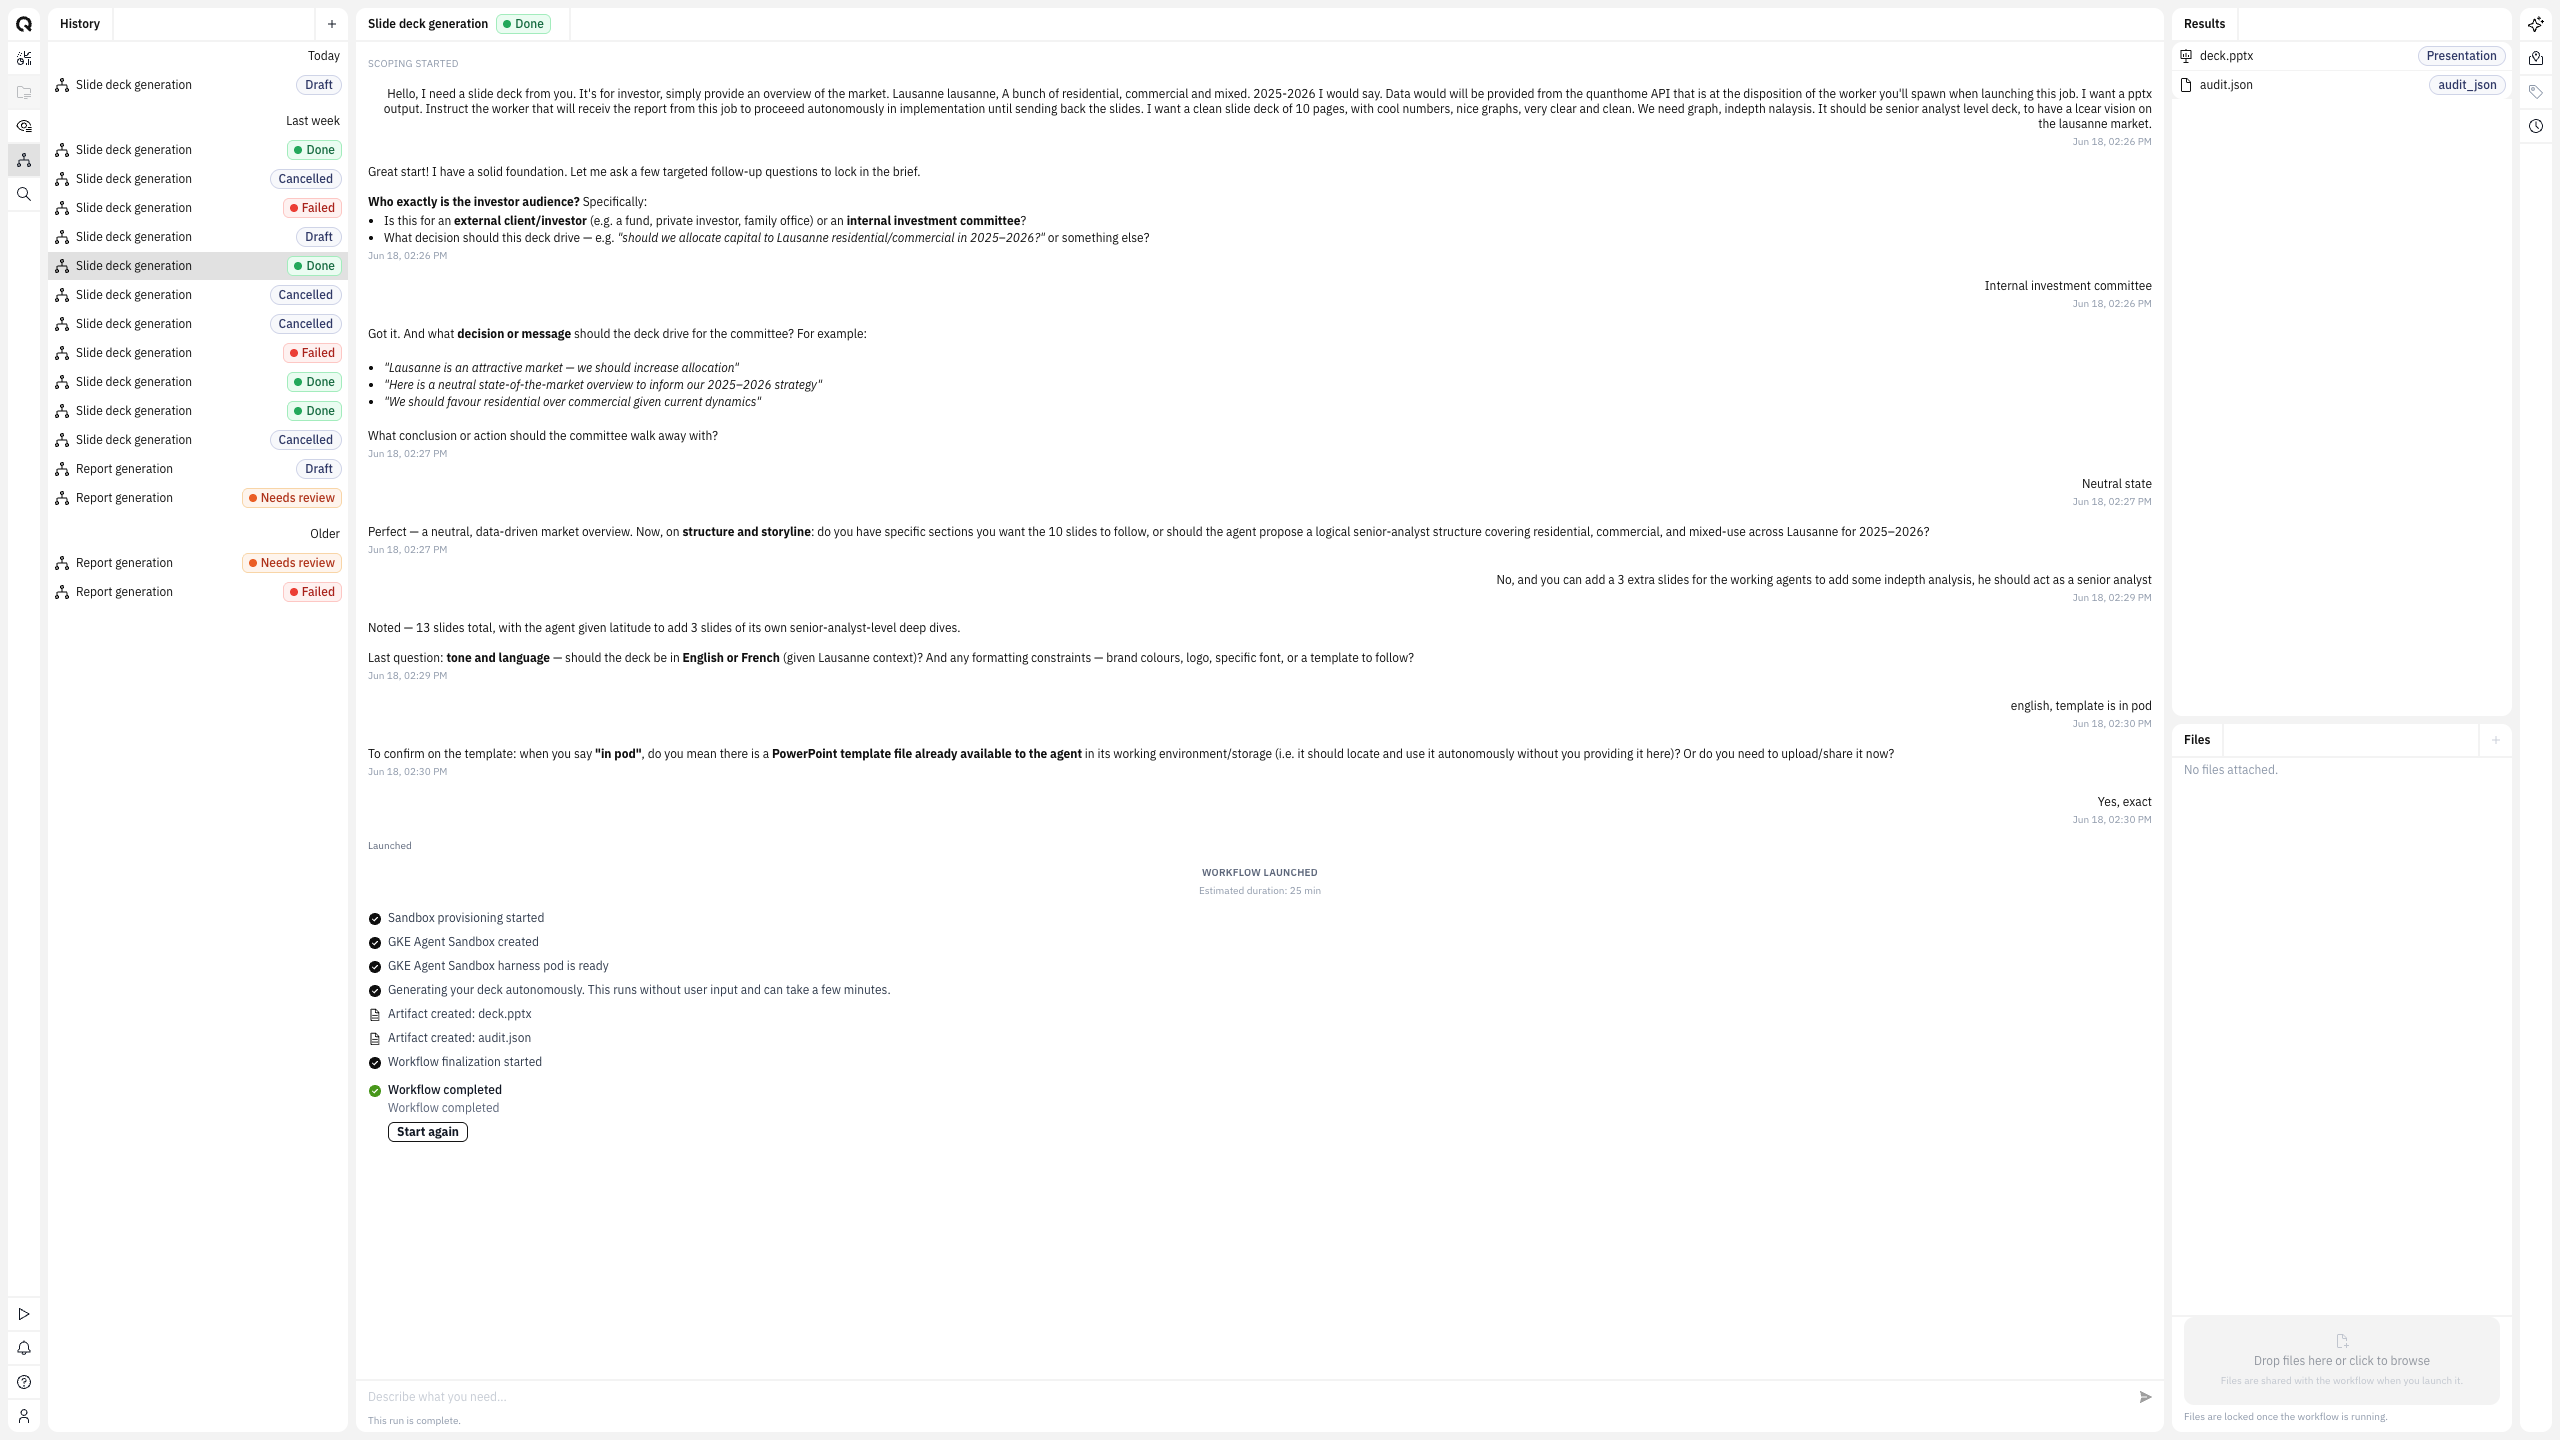
Un harnais d'agents d'IA managés assemble le rapport de bout en bout dans votre modèle, chaque chiffre étant récupéré dans la base au moment de la génération et citant sa source. Les chiffres qui ne concordent pas apparaissent à la génération, quand les corriger coûte peu, et non tard dans le cycle, lorsque rouvrir le document est le plus coûteux.
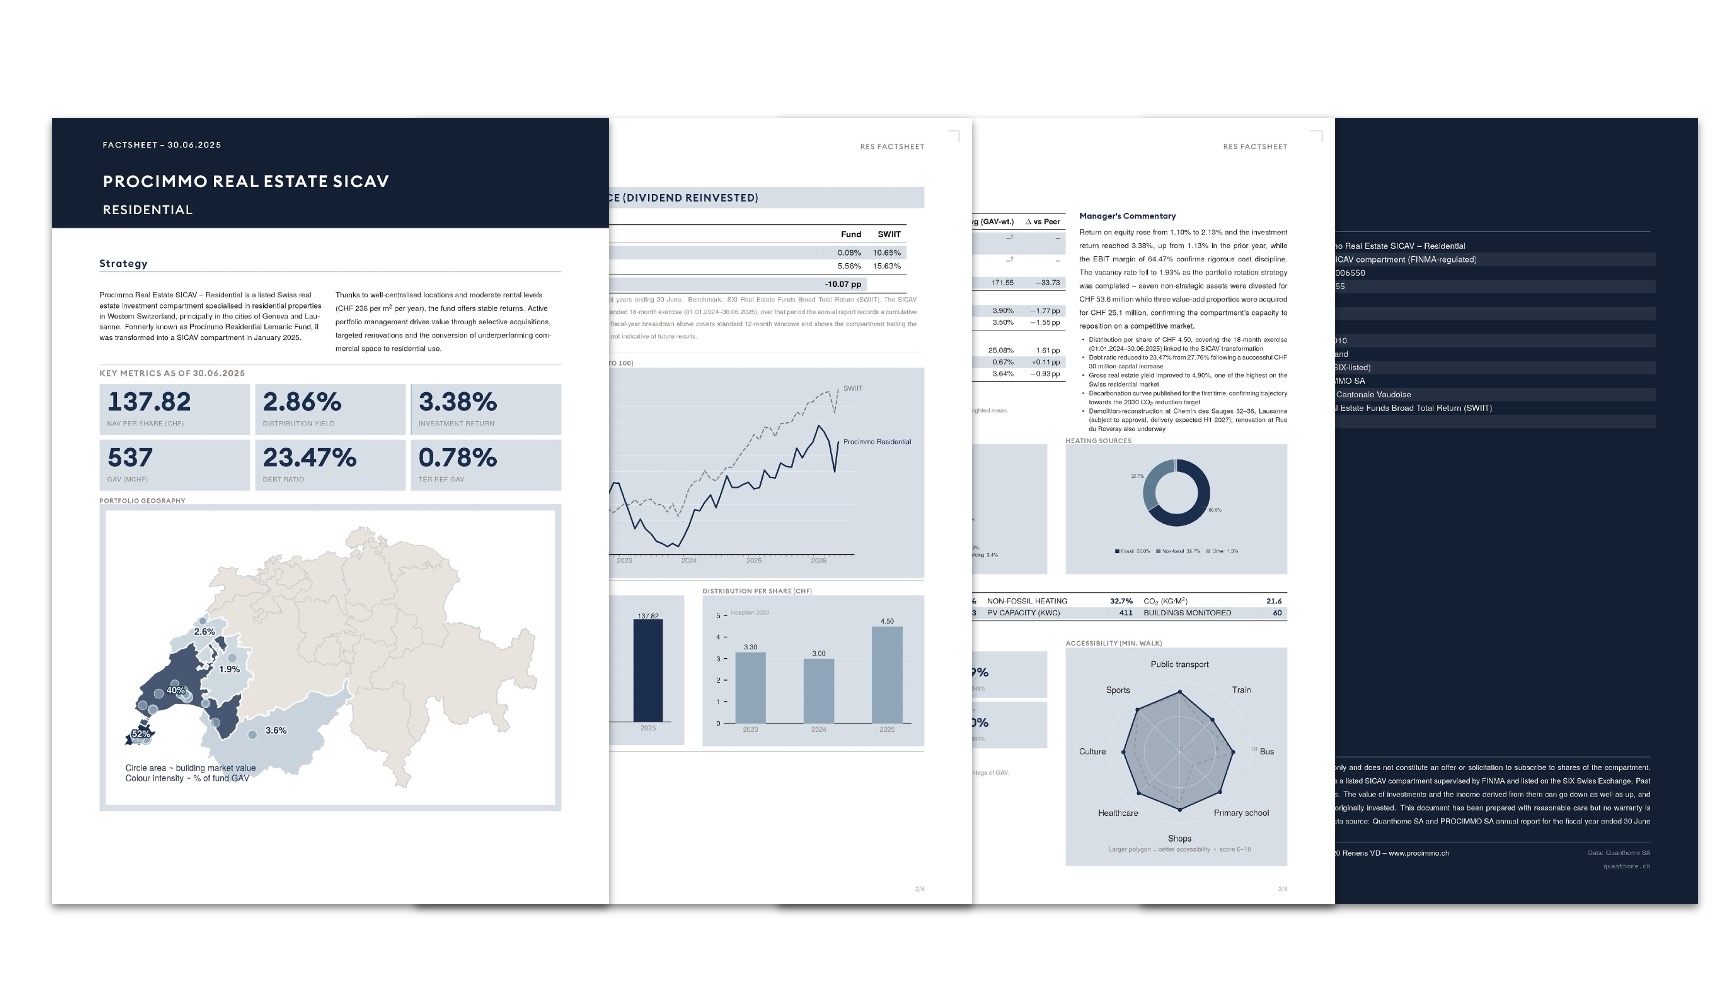
Générez l'ensemble complet des factsheets de fonds et de portefeuilles en une seule passe, dans le format maison que vos investisseurs attendent déjà. Aucun chiffre n'est ressaisi et aucun graphique reconstruit fonds par fonds : une semaine de production trimestrielle se ramène à quelques minutes.
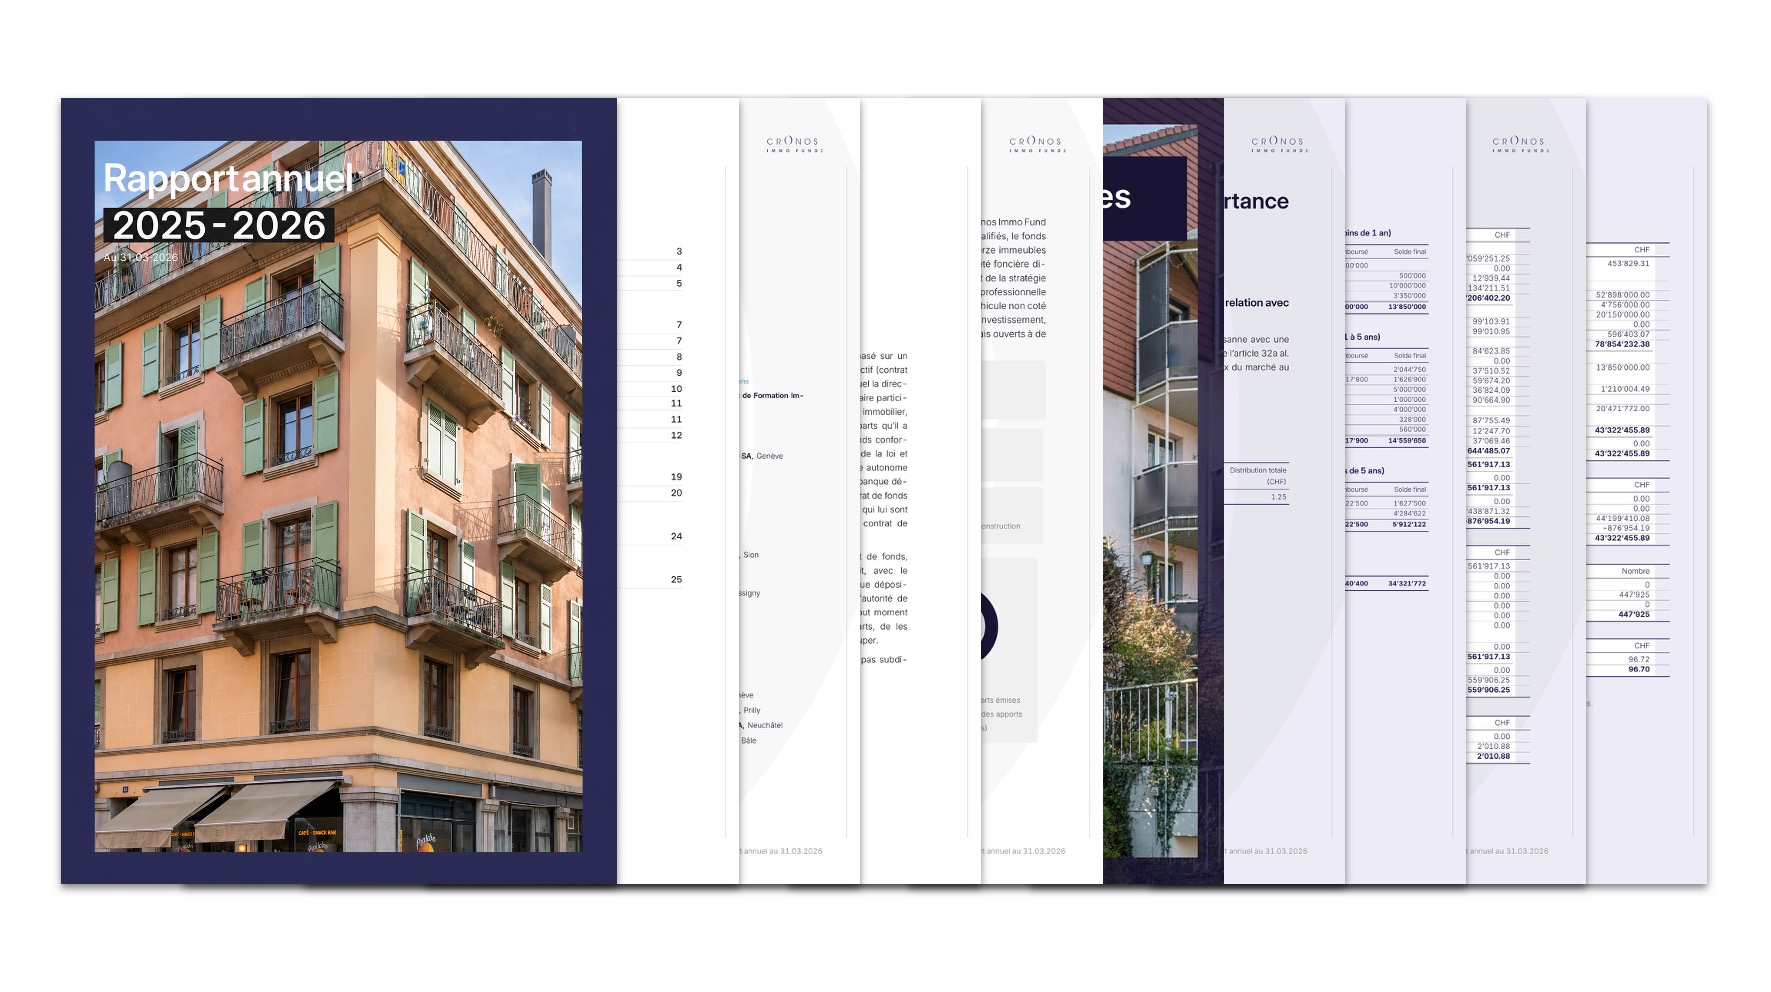
Tableaux, graphiques et chiffres sont assemblés à partir d'une seule base structurée et se réconcilient par construction : l'audit reçoit un projet traçable en quelques jours plutôt qu'en quelques mois. Chaque chiffre remonte à son enregistrement source ; l'équipe rédige commentaire et jugement autour de chiffres qui concordent déjà.
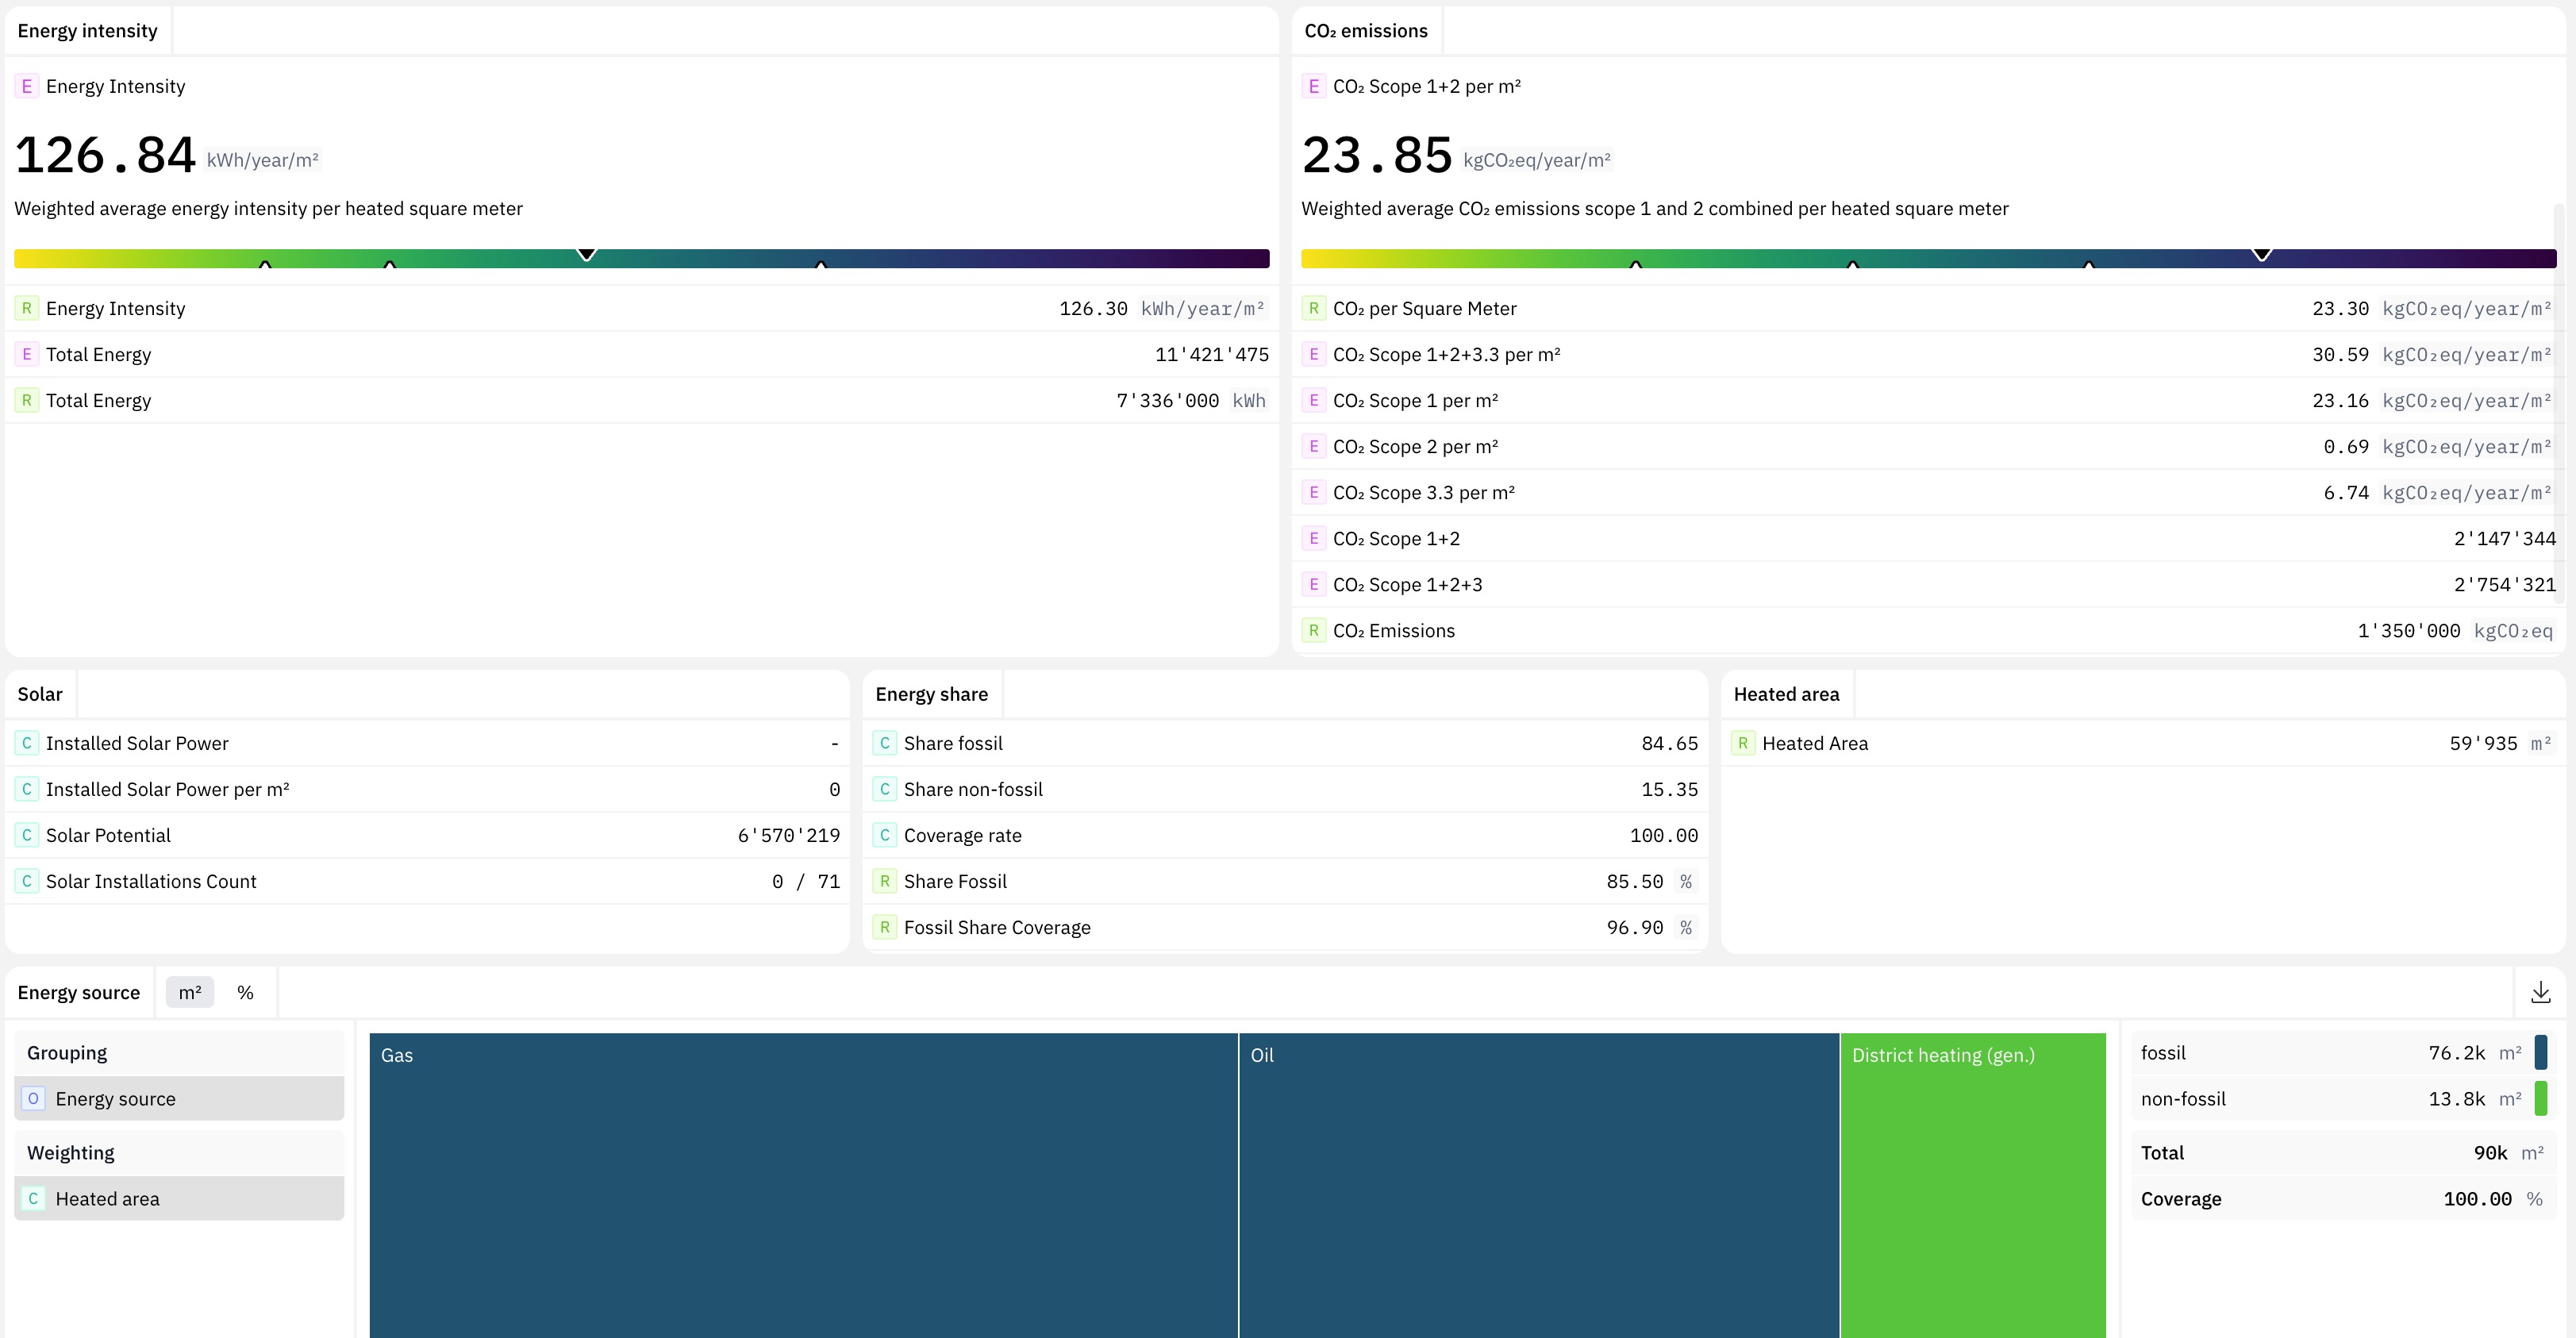
L'énergie, le CO₂ sur les scopes 1, 2 et 3 et le risque climatique sont résolus au niveau de l'immeuble et agrégés au portefeuille à partir d'actifs réels, pas d'estimations. Lorsque le cadre change, la même base est régénérée dans le nouveau modèle : le rapport est régénéré plutôt que recollecté.
Pensé pour
Les équipes de fonds, financières et ESG qui doivent produire des rapports obligatoires dans les délais.
Propriétaires et gérants
Quanthome offre aux propriétaires en direct et aux régies qui exploitent leurs immeubles une vue unique et cohérente au niveau de l'immeuble, performance, location, capex et risque, à partir des mêmes données.
Allocataires d'actifs et investisseurs immobiliers indirects
Une vue unique sur vos immeubles détenus en direct et vos participations indirectes. Rapports et décisions en heures, pas en semaines.
Advisors, consultants & brokers
Conseillez vos clients à partir de données de transactions et de marché actuelles, pas d'un deck reconstruit à la main. Passez moins de temps à produire des decks et plus à l'analyse pour laquelle le client vous rémunère.
Prestataires de services et évaluateurs
Exécutez le même processus reproductible à chaque cycle, au rythme du régulateur, à partir d'un seul jeu de données suisse structuré plutôt que d'une nouvelle collecte à chaque fois.
Pour aller plus loin
Quanthome Platform
L'atelier de l'analyste pour l'immobilier.
Quanthome Data Engine
Des documents éparpillés à une seule vue structurée et auditée.
Quanthome AI
Des tableaux de bord à la demande, générés à partir d'une question.
API & MCP
Vos outils, nos données.
Quanthome Workflows
Des données structurées aux livrables finis.
Les meilleures équipes immobilières utilisent Quanthome pour
Repérer les loyers sous-évaluésExplorer tous les cas d'usageComment Quanthome soutient le reporting automatisé
Le reporting agentique en pratique : des données structurées à un rapport publiable
Le calendrier de reporting dans les fonds immobiliers : où passent réellement les semaines
Immobilier suisse : les pratiques ESG réévaluées pour 128 véhicules d'investissement
Ce que l'on nous demande avant d'automatiser un rapport
Qu'est-ce que l'automatisation du reporting dans l'immobilier ?
L'automatisation du reporting est la génération des rapports obligatoires, factsheets, rapports annuels et publications ESG, à partir de données structurées plutôt que par assemblage manuel. Quanthome conserve les données de fonds, d'immeubles et ESG dans une seule base structurée et exécute des workflows d'IA sur mesure qui produisent chaque rapport dans le modèle que vous maîtrisez, chaque chiffre étant récupéré au moment de la génération et citant sa source : un cycle de copie manuelle devient une exécution de génération.
Quels rapports Quanthome peut-il automatiser ?
Les factsheets de chaque fonds et portefeuille, le rapport annuel complet et les rapports ESG sur l'énergie, le CO₂ et le risque climatique, ainsi que le reporting de portefeuille récurrent. Chacun est encodé une fois comme un workflow sur votre base structurée, puis exécuté à la demande. Les rapports partagent une seule base : un chiffre corrigé une fois se répercute dans chaque rapport qu'il alimente, au lieu d'être corrigé document par document.
Pouvons-nous conserver nos propres modèles et notre format maison ?
Oui. Vous définissez le modèle une seule fois, mise en page, graphiques et sections comprises, et Quanthome le remplit pour chaque fonds, portefeuille et période de reporting. Le résultat correspond au format que vos investisseurs et régulateurs attendent déjà ; seule la production est automatisée. Le document publié se lit comme votre rapport, pas comme un export système, car le modèle reste le vôtre.
D'où proviennent les chiffres, et sont-ils traçables ?
De vos données, structurées par le Data Engine en une seule base interrogeable, combinées à la couverture marché et ESG de Quanthome. Les chiffres sont récupérés au moment de la génération plutôt que copiés d'un fichier à l'autre : chaque rapport reflète des données actuelles, et chaque chiffre porte une référence à son enregistrement source, de sorte que la relecture part de la citation plutôt que d'une recherche et que les chiffres se réconcilient par construction.
Combien de temps l'automatisation fait-elle réellement gagner ?
Les clients constatent environ 90 % de temps en moins pour le rapport annuel d'un fonds, et une semaine de production trimestrielle de factsheets se ramène à quelques minutes. La base et les modèles persistent entre les cycles : le rapport suivant se régénère sur données actuelles plutôt qu'à partir d'un document vierge, et une correction tardive se répercute partout où elle s'applique au lieu de relancer le cycle.
Environ 90 % de temps en moins pour le rapport annuel d'un fonds. Des factsheets en quelques minutes. Un ESG qui se régénère.
Apportez un rapport que vous produisez aujourd'hui. Nous l'encoderons comme un workflow avec vous lors d'une séance de travail et le générerons à partir de vos données structurées.
Réserver une séance de travail