Peer Analysis for Real Estate Investment Vehicles
The problem
Reading where a real estate vehicle stands means pulling factsheets that were never built to be compared. Every review, someone rebuilds the same peer comparison by hand from inconsistent disclosures, and it is stale before the meeting.
What Quanthome does
Compare any Swiss REIV against named indices or a custom peer set across tenants, asset allocation and ESG, on one maintained base of 140+ vehicles, and save the peer set so the next review is a refresh, not a rebuild.
See where any vehicle stands, on one base.
Read the whole peer set
Compare tenants, asset allocation and ESG for a vehicle and its peers side by side, on one maintained base of 140+ REIVs, not on factsheets built to be read alone.
Stop normalising by hand
Every metric is read on like-for-like terms, so no one re-collects disclosures or re-keys each vehicle's own format before the comparison can begin.
Refresh, never rebuild
A saved peer set reopens on current figures at the next review, moving the time from assembling the comparison to reading where the vehicle stands.
How analysts see where any vehicle stands
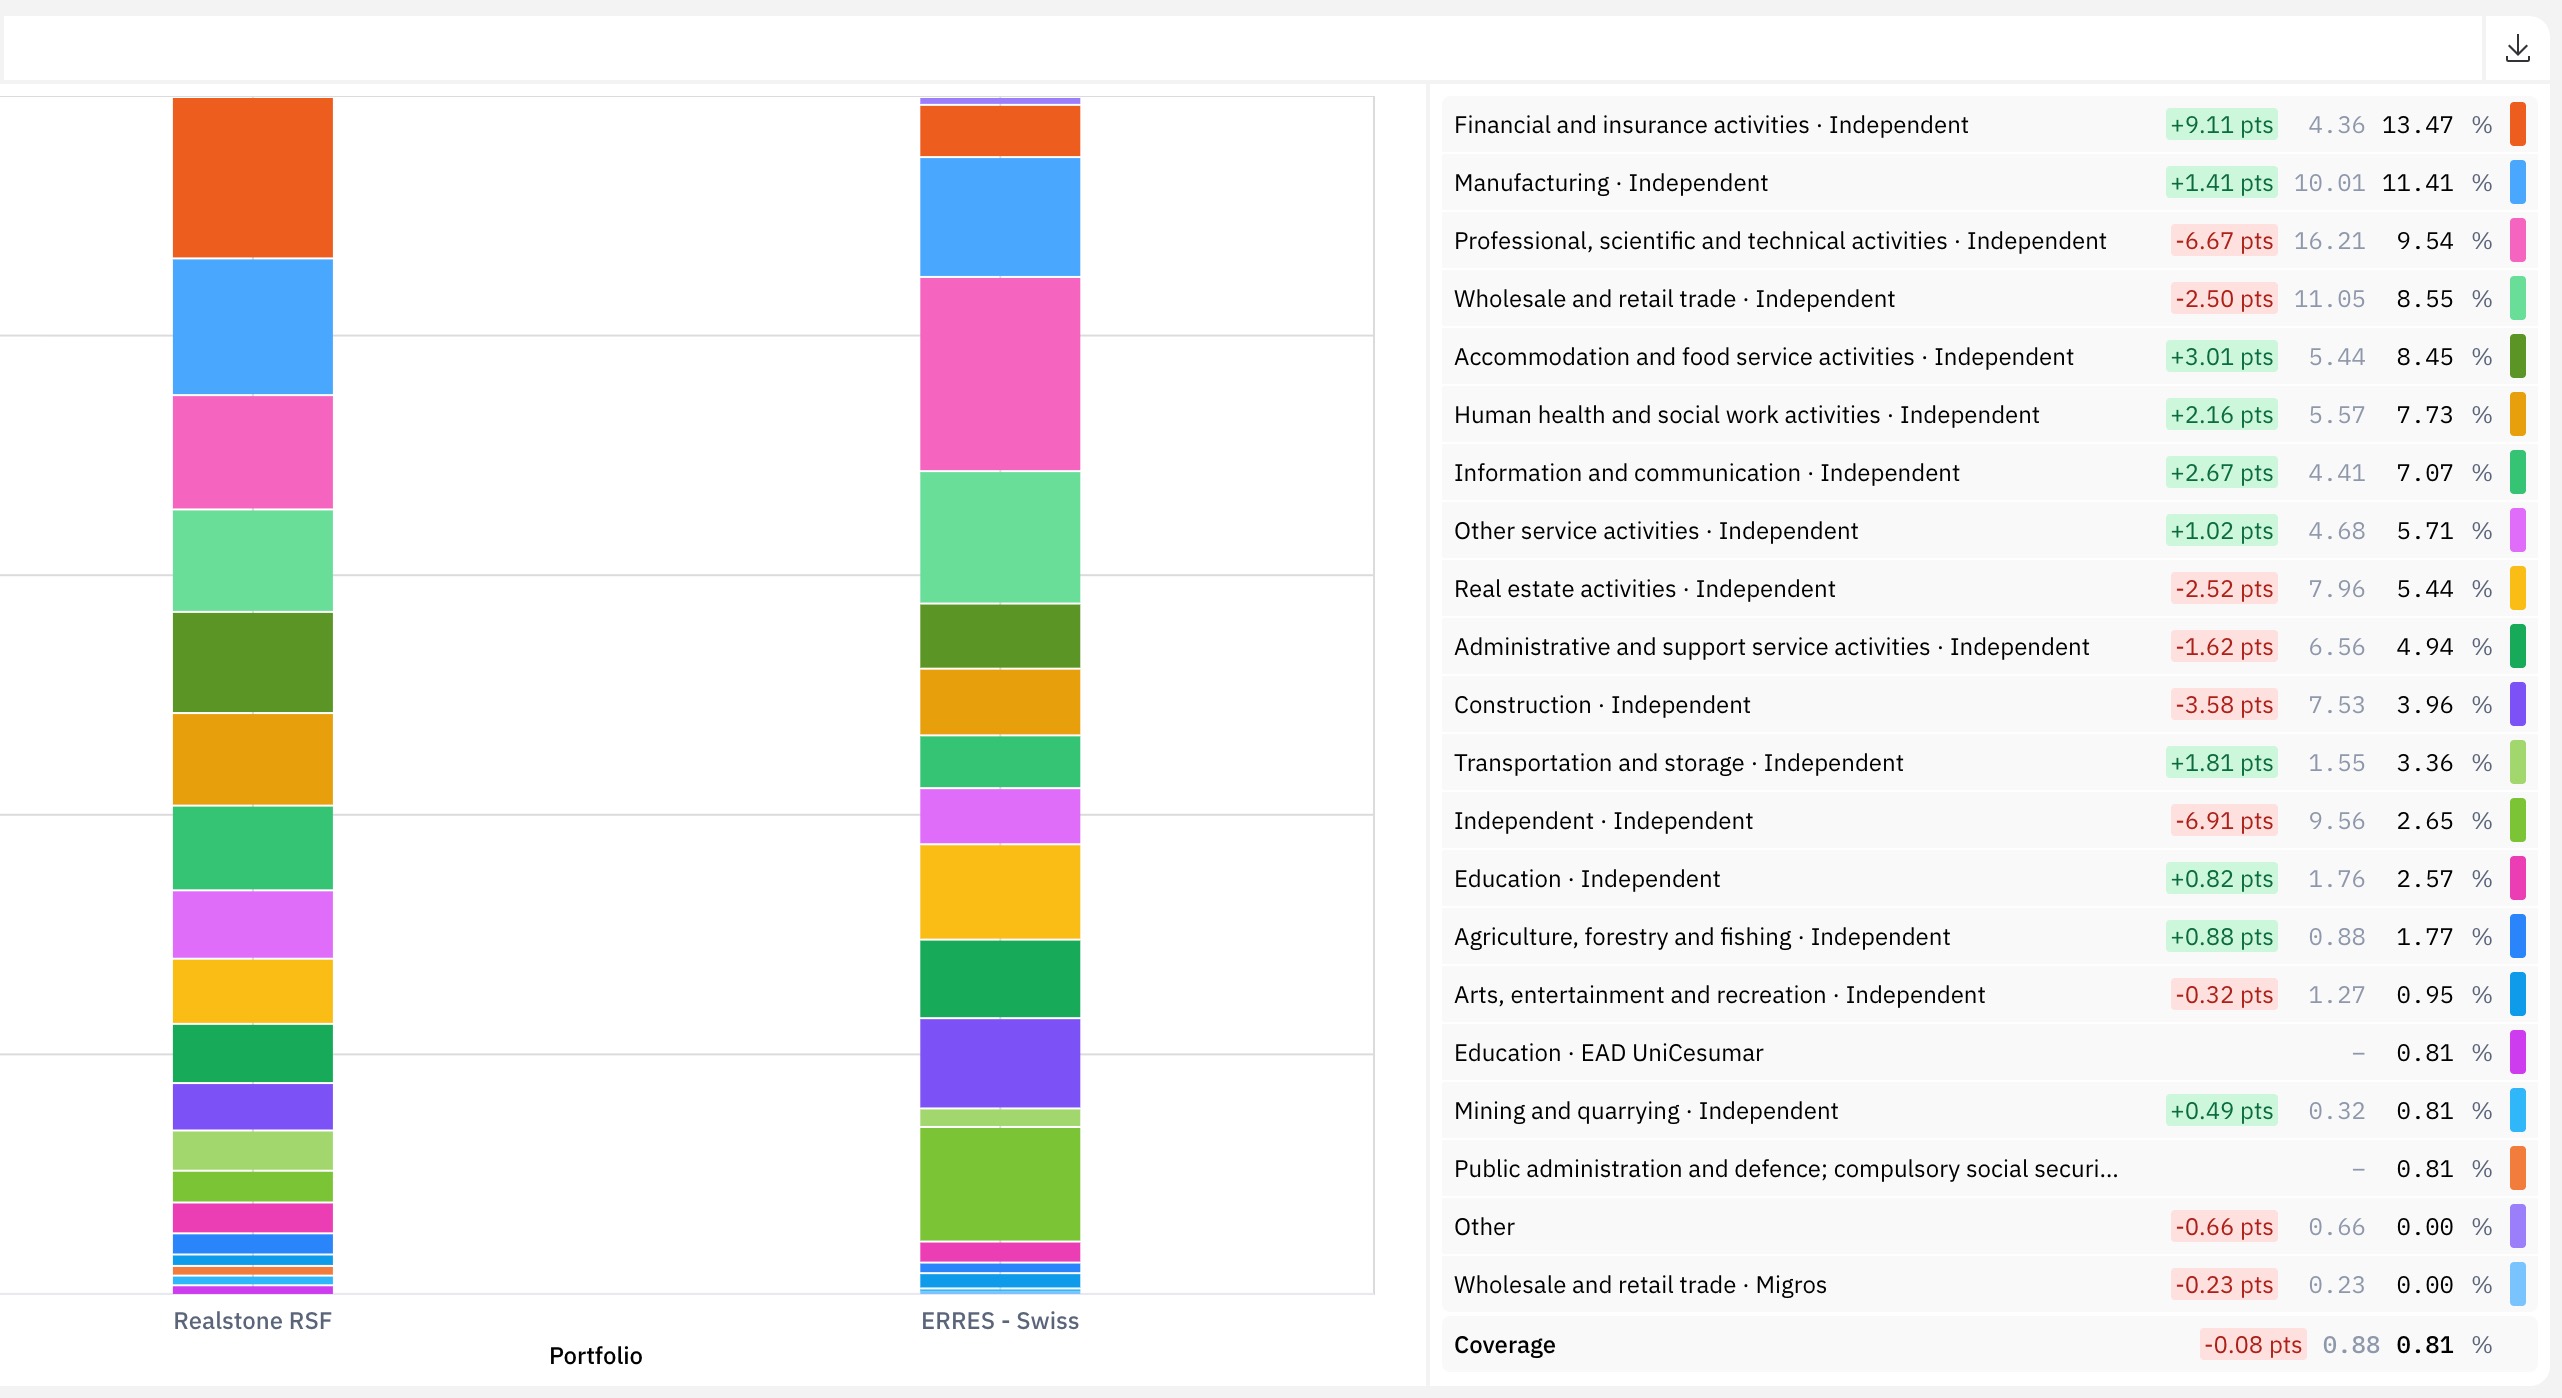
Compare tenant concentration, lease maturity and sector mix across the fund and its peers, side by side. Tenant exposure is drawn from the same maintained base as every other metric, so it is read on like-for-like terms, not each vehicle's own disclosure format.
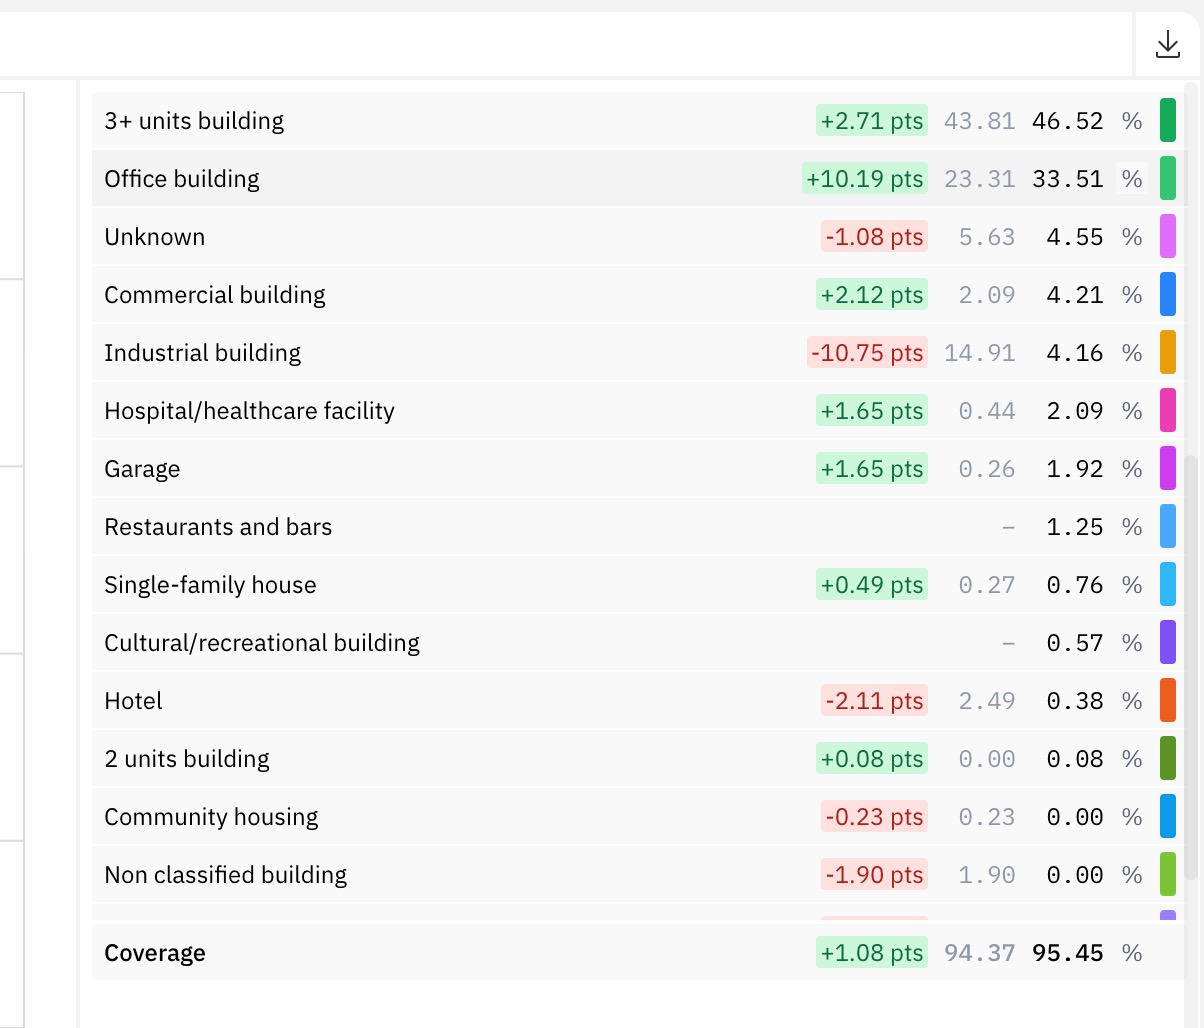
Compare how the fund and its peers allocate across property type, region and use, on one consistent breakdown. See where a vehicle is over- or under-weight versus its peer set before a single factsheet is opened.
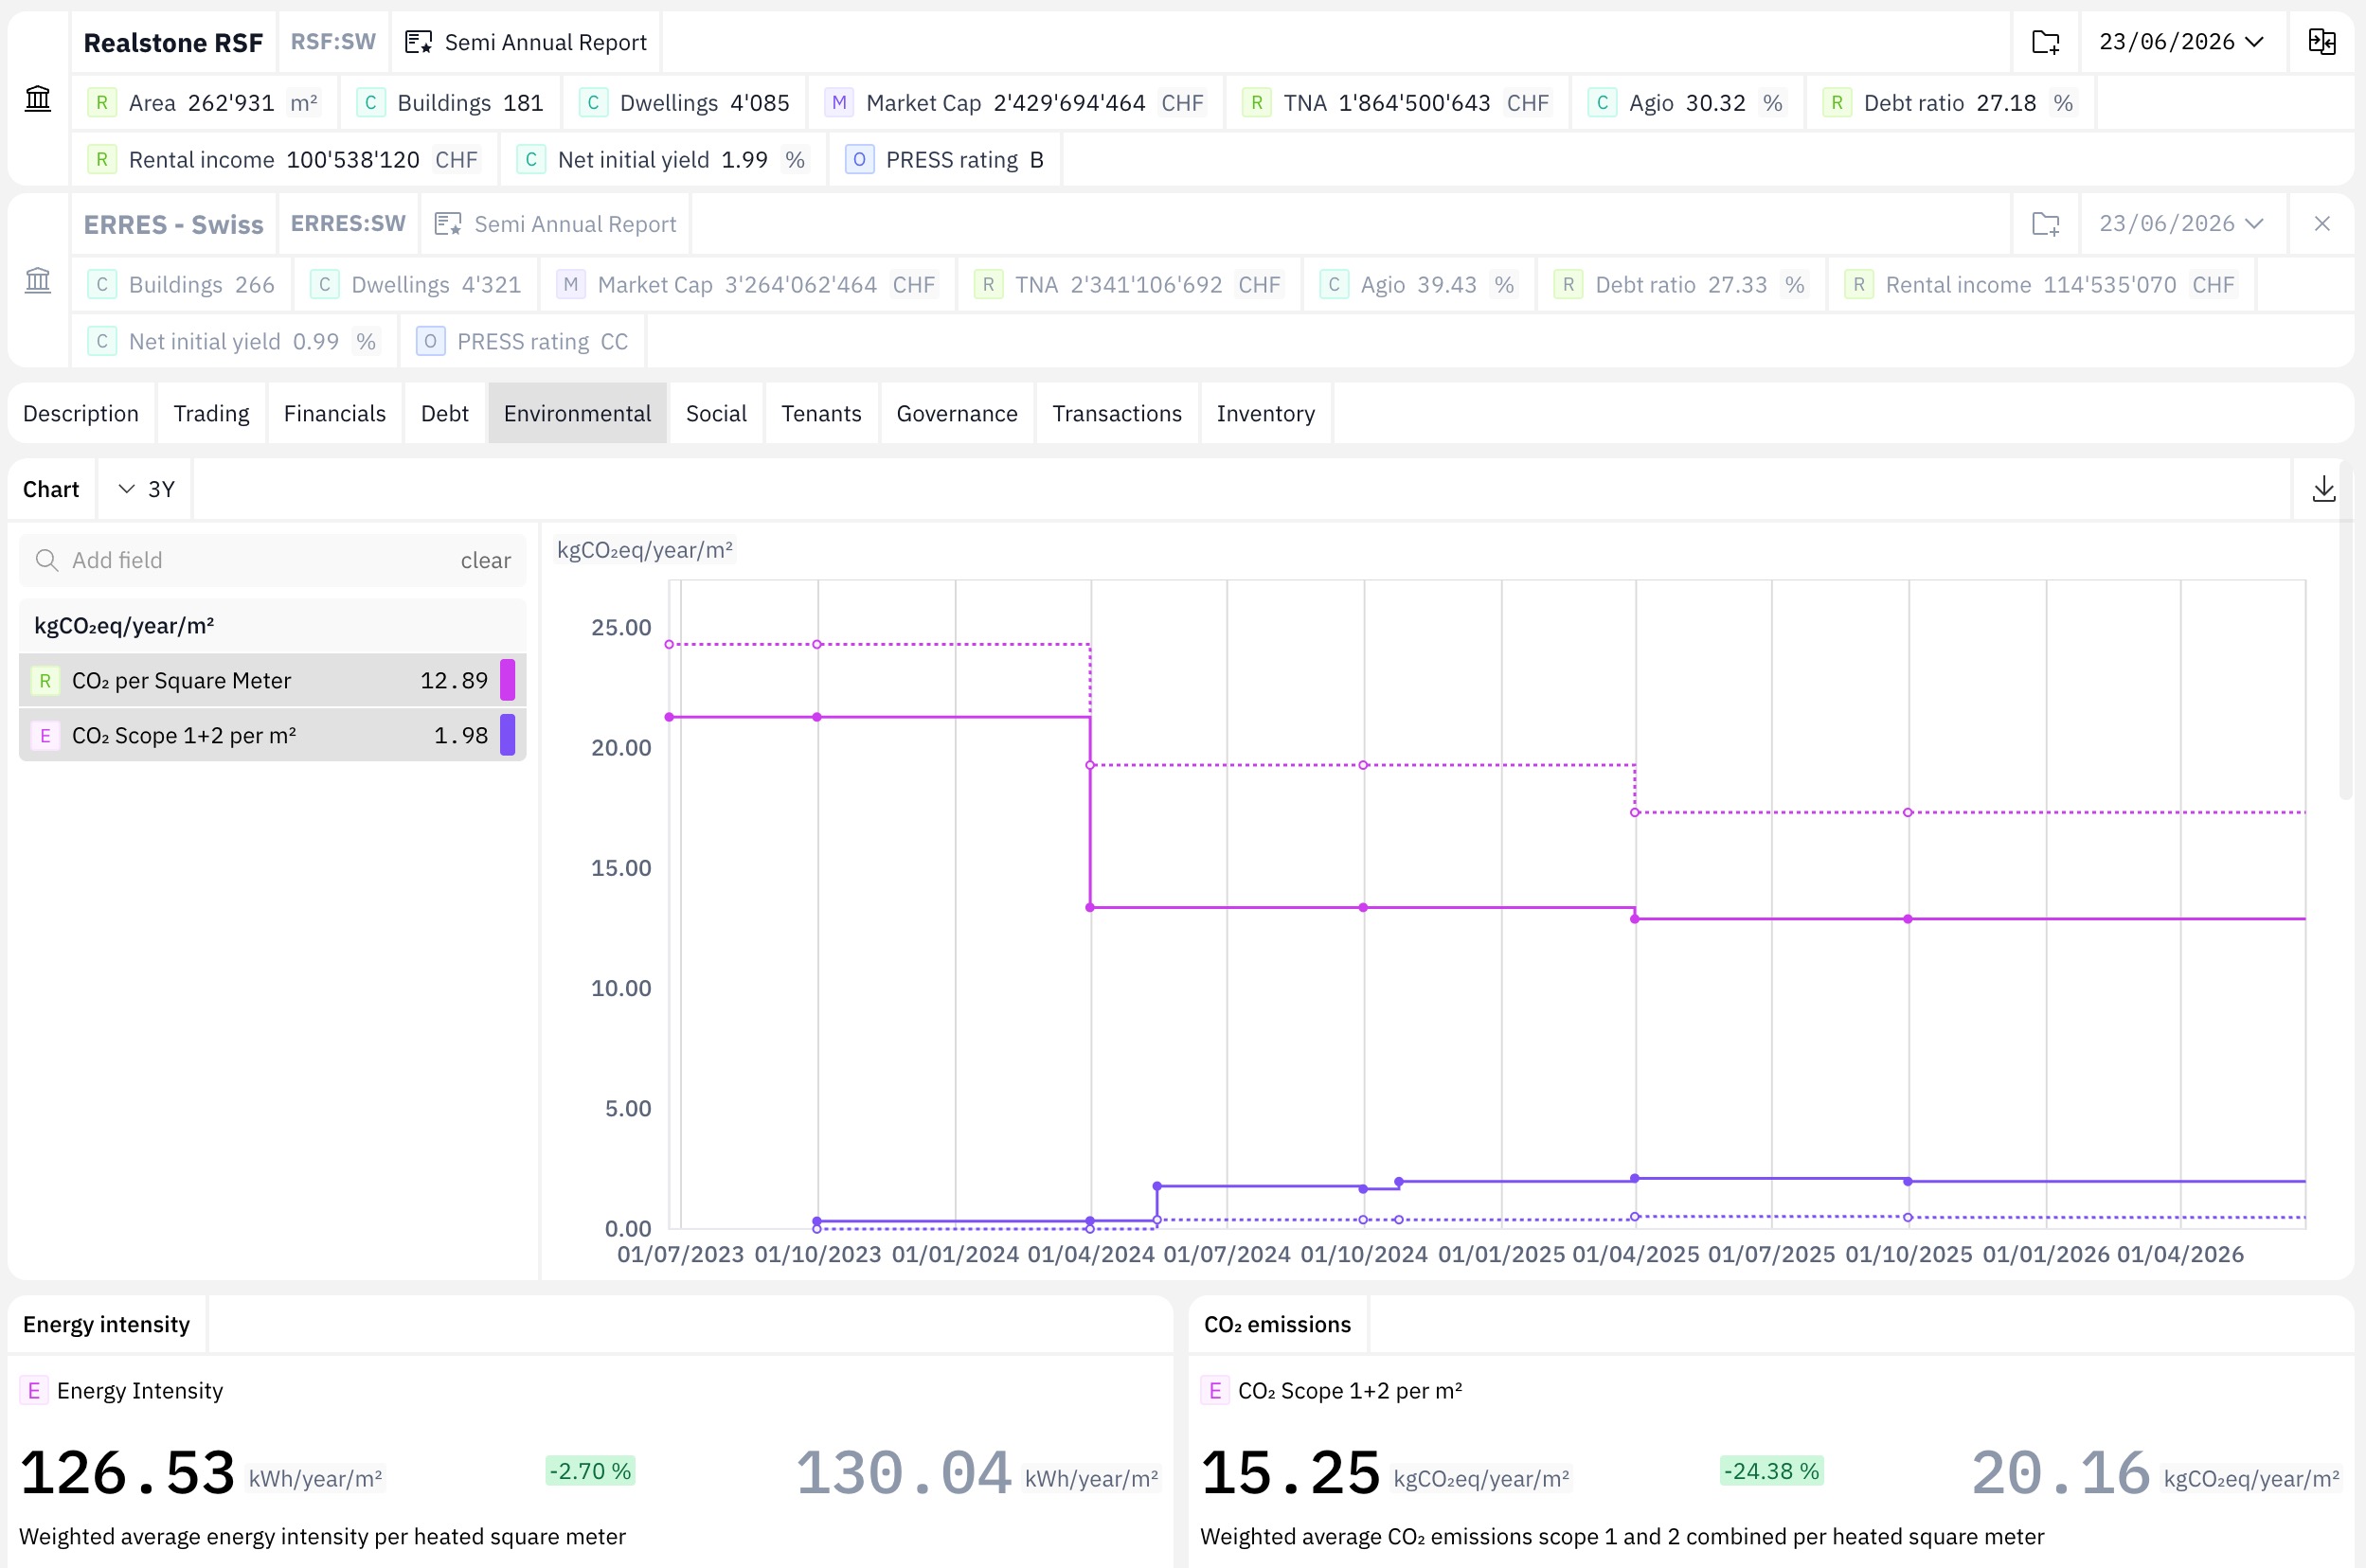
Benchmark energy intensity, carbon intensity and ESG ratings across the fund and its peers on comparable figures. Read the vehicle's ESG standing against named indices or a custom peer set, refreshed on current data at every review.
Built for
The investment teams and advisers that benchmark real estate vehicles against their peers.
Owners & operators
Quanthome gives direct asset owners and the property managers who run their buildings one consistent, building-level view, performance, tenancy, capex and risk, from the same data.
Asset allocators & indirect real estate investors
One view across your direct buildings and your indirect holdings, so reports and decisions land in hours, not weeks.
Advisors, consultants & brokers
Advise clients on current transaction and market data, not a deck rebuilt by hand. Spend less time producing decks and more on the analysis the client pays for.
Service providers & valuers
Run the same repeatable process every cycle, on the regulator's timetable, from one structured Swiss dataset rather than a fresh round of data collection each time.
Researchers
The full real estate dataset, covering buildings, transactions and vehicles, ready for research and market analysis.
Explore further
Quanthome Platform
The analyst workbench for real estate.
Quanthome Data Engine
From scattered documents to one structured, audited view.
Quanthome AI
Page-on-demand dashboards, generated from a question.
API & MCP
Your tools, our data.
Quanthome Workflows
From structured data to finished deliverables.
See How Quanthome Supports Peer Analysis
Peer benchmarking Swiss real estate funds: why factsheets are not built to be read together
Defining a peer set for a Swiss real estate fund: named indices or a custom group
Beyond returns: reading ESG, gearing and tenant exposure across a peer set
What People Ask Before the First Peer Screen
What is fund peer analysis?
Fund peer analysis compares a real estate fund against comparable vehicles or an index on consistent metrics, covering returns, valuation, ESG profile, debt and tenant exposure, to read where the fund stands. In Quanthome the comparison runs on one maintained base covering 140+ Swiss REIVs, so peers line up without hand-normalising disclosures fund by fund.
Which peers and indices can a fund be compared against?
Named indices including SWIIT, SREAL, REAL, SPI, SBI and SMI, plus any custom peer set you define from the 140+ covered Swiss REIVs. The peer set is built to fit the question being asked, then stored with the comparison so the next review reopens the same set on current data.
What dimensions does a peer comparison cover?
A peer comparison covers financial and valuation metrics, ESG profile, debt and gearing, tenant exposure and asset allocation, side by side in one view. Every dimension is drawn from the same maintained base of 400+ data fields per asset, so funds are read on like-for-like figures rather than on each vehicle's own disclosure format.
How current is a peer comparison?
Comparisons draw on maintained data rather than on disclosures collected for each review, so the figures reflect the current state of the base when the screen is opened. A saved peer set refreshes on current data at every review instead of being rebuilt by hand, which keeps the comparison from going stale before the meeting.
How does a saved peer set save time at the next review?
A saved peer set carries its peers, its indices and its metrics forward. The next review reopens the same screen on current data rather than a blank sheet, so no disclosures are re-collected and nothing is re-normalised. The time moves from assembling the comparison to reading it.
CHF 250B+ of Fund NAV. One Maintained Base. Peer Screens That Refresh Instead of Rebuild.
Tell us the fund and the peers. We will run the comparison with you in a working session.
Book a working session