Custom AI Dashboards for Real Estate Data
Describe the question in plain language, get a dashboard that combines your data and Quanthome market data in seconds, and keep it live so the next answer is a refresh, not a rebuild. Quanthome generates custom dashboards from a question described in plain language, combining your own data with Quanthome market data on one structured base. Every figure cites its source, and the view is native to the data, so it refreshes as the data updates. A new question becomes a dashboard in seconds, not an IT project.
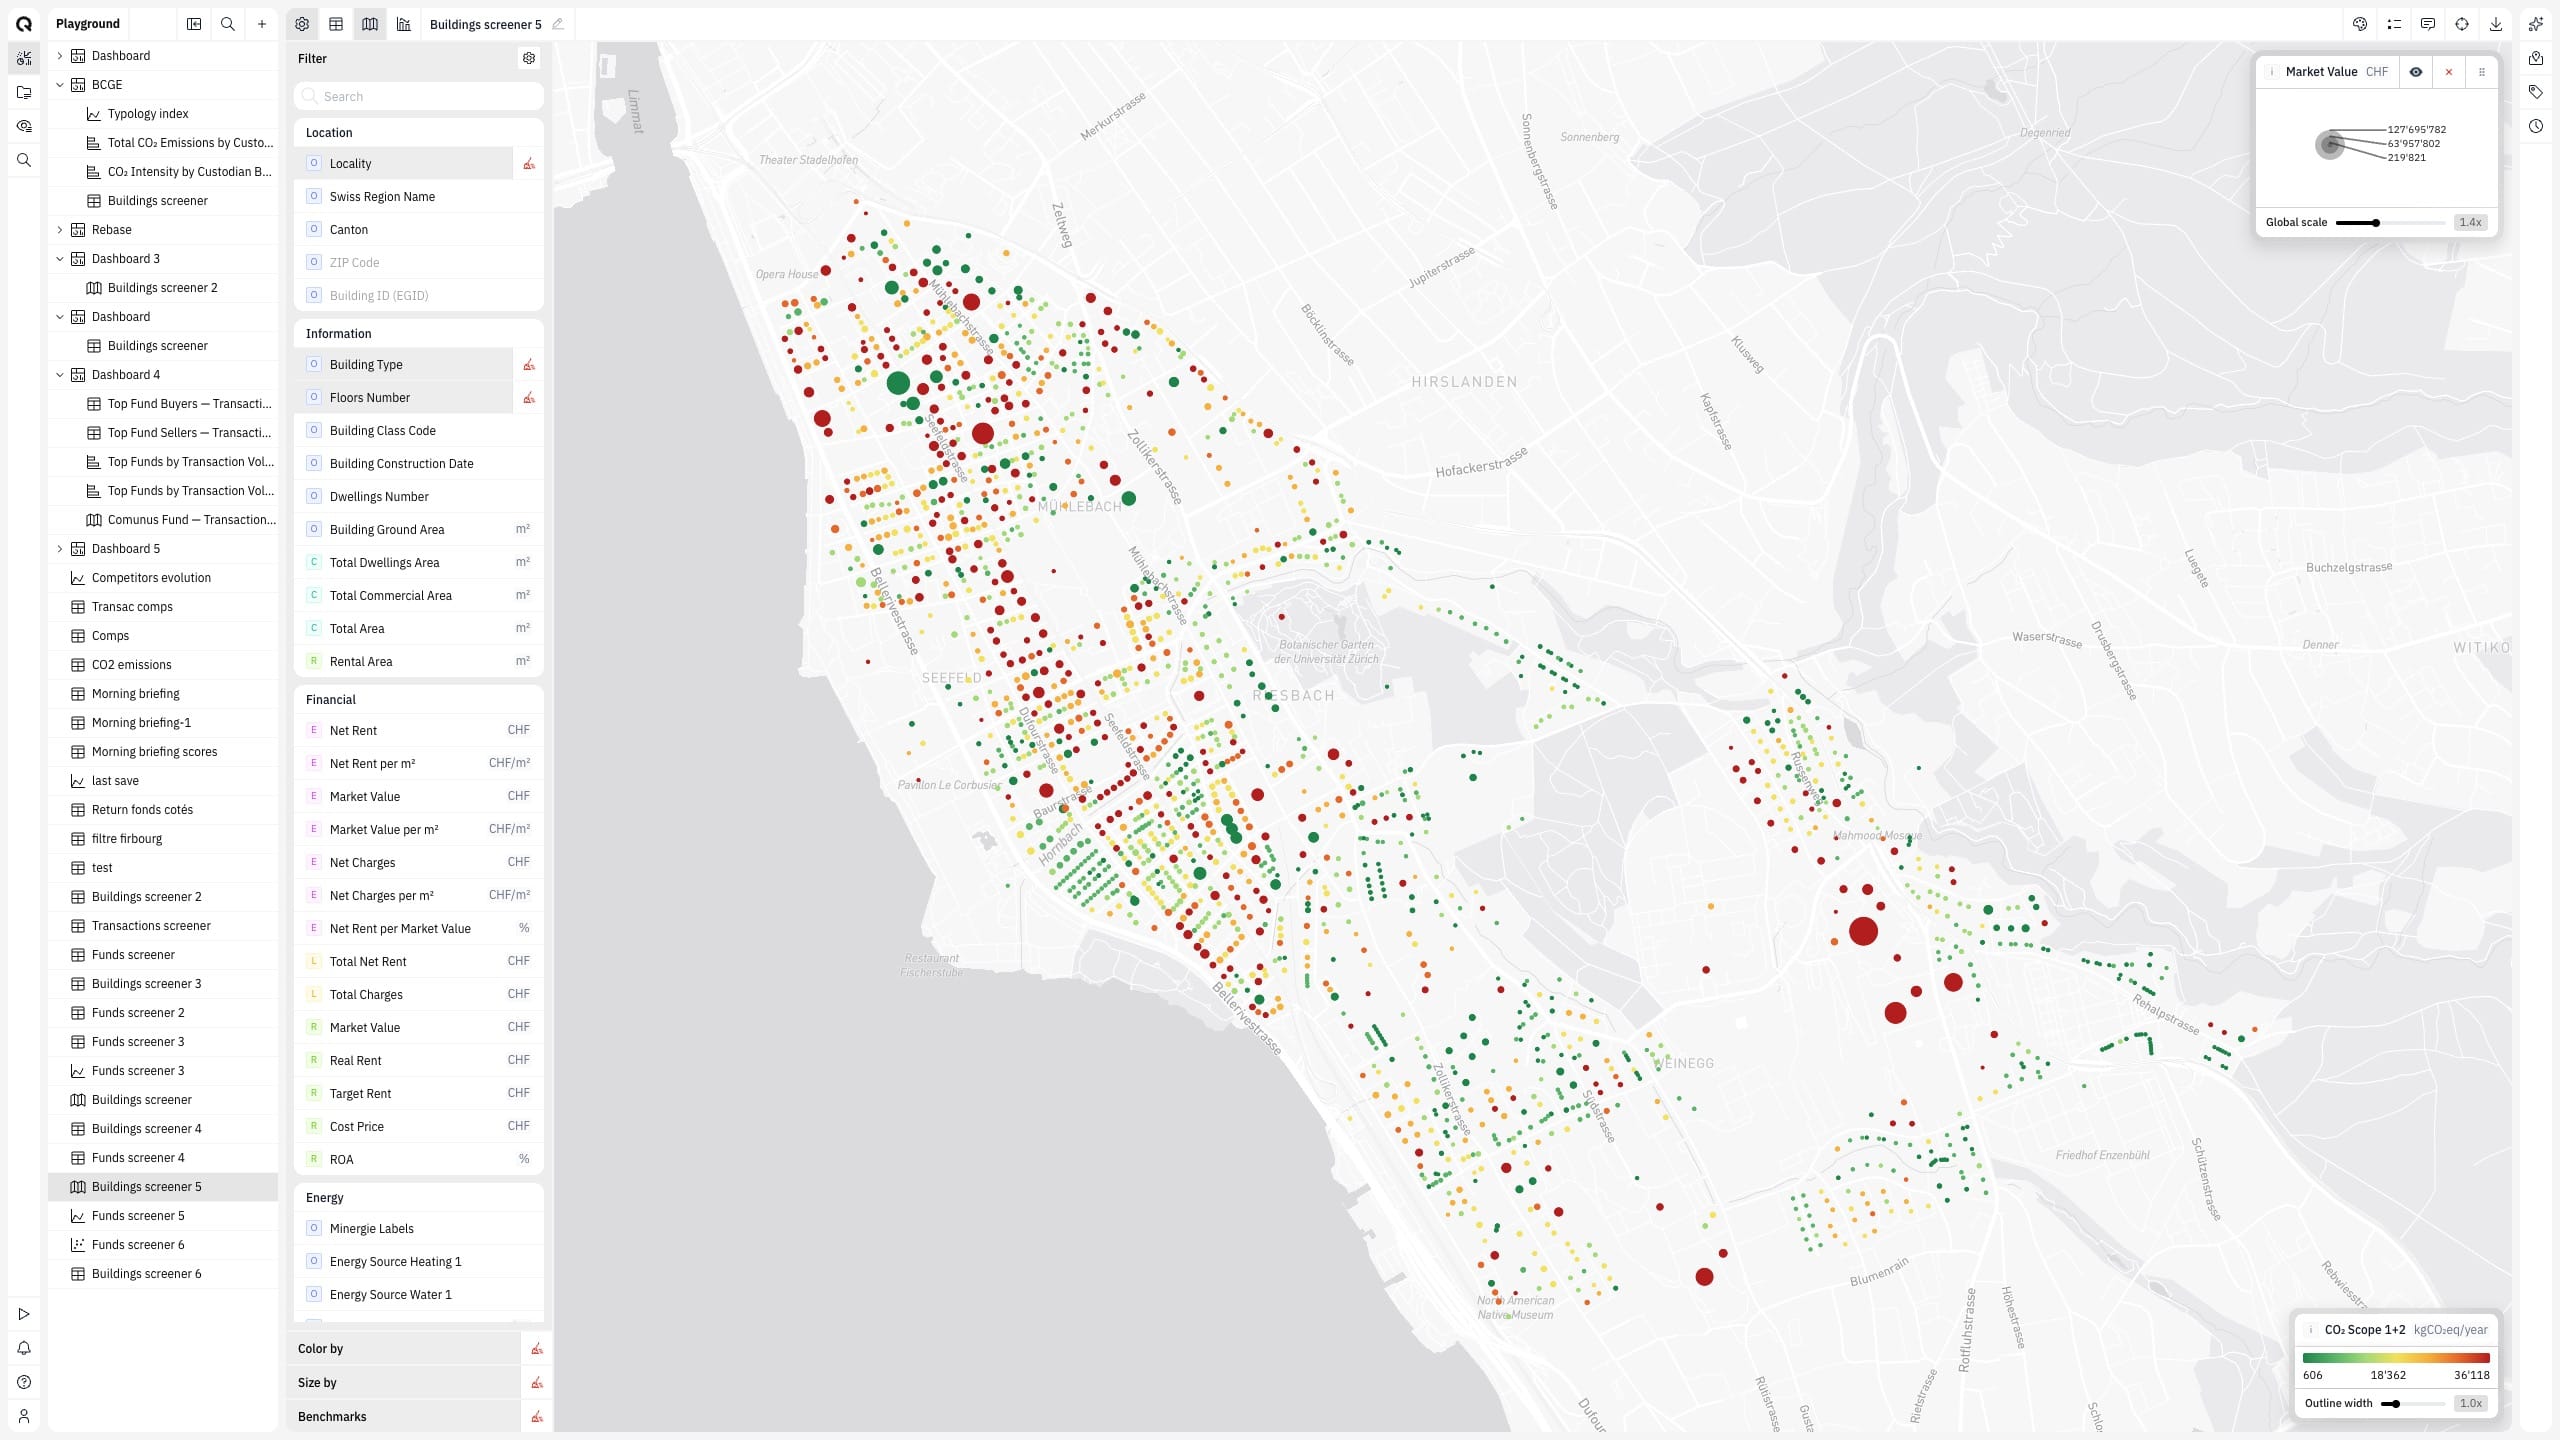
Ask the question, read the answer.
See your data beside the market
Read your own portfolio figures next to Quanthome market data in one dashboard, on a structured base of 400+ fields per asset, not reconciled by hand across two unconnected tools.
Skip the build queue
Describe the question in plain language and the view is generated from structured data, no specification, no multi-day IT build, and every figure already cites its source.
Refresh, never rebuild
A generated dashboard is native to the data, so when the question returns it reopens on current figures rather than a stale export, moving the time from building views to reading them.
How analysts turn a question into a dashboard
Describe the question your team keeps asking in plain language. A page-on-demand interface generates the dashboard from structured data in seconds, not a multi-day IT build. Every figure in the generated view cites its source, so review starts from the citation rather than a search. No build backlog and no specification. The team that has the question gets the view itself.
The Data Engine structures your own data so it sits alongside Quanthome market data (deep coverage of the real-estate market with 400+ fields per asset) in the same dashboard. Portfolio figures are benchmarked against their market context directly in the generated view, instead of being reconciled across two unconnected tools. A generated view and a standing report agree, because they sit over the same structured base as portfolio reporting and risk dashboards.
The generated dashboard is native to the structured data, so it refreshes as the underlying data updates rather than going stale. When the question returns, the view reopens on current data, not a stale export or a new build request. Time moves from building views to reading them.
Built for
The Swiss real estate desks this job is built for.
Owners & operators
Quanthome gives direct asset owners and the property managers who run their buildings one consistent, building-level view, performance, tenancy, capex and risk, from the same data.
Asset allocators & indirect real estate investors
One view across your direct buildings and your indirect holdings, so reports and decisions land in hours, not weeks.
Advisors, consultants & brokers
Advise clients on current transaction and market data, not a deck rebuilt by hand. Spend less time producing decks and more on the analysis the client pays for.
Service providers & valuers
Run the same repeatable process every cycle, on the regulator's timetable, from one structured Swiss dataset rather than a fresh round of data collection each time.
Researchers
The full real estate dataset, covering buildings, transactions and vehicles, ready for research and market analysis.
Explore further
Quanthome Platform
The analyst workbench for real estate.
Quanthome Data Engine
From scattered documents to one structured, audited view.
Quanthome AI
Page-on-demand dashboards, generated from a question.
API & MCP
Your tools, our data.
Quanthome Workflows
From structured data to finished deliverables.
See How Quanthome Supports Agentic Reporting
Agentic reporting in practice: from a plain-language question to a cited dashboard
Your data beside the market: what structuring portfolio data actually takes
The dashboard backlog: what waiting on an IT build queue costs an investment team
What People Ask Before the First Dashboard
What is a custom AI dashboard?
A custom AI dashboard is a view generated on demand from a question described in plain language, rather than built to a specification in an IT queue. In Quanthome, a page-on-demand interface generates the dashboard from structured data in seconds, combining your own data with Quanthome market data, and every figure in the generated view cites its source.
Do we need IT to build a dashboard?
No. Dashboards are generated on demand from a described question, so a new view does not depend on an internal build backlog. The team that has the question describes it in plain language and gets the view itself, in seconds rather than days, and internal IT capacity stops being the constraint on how many views the team can have.
Can a dashboard use our own data?
Yes. The Data Engine structures your own data so it sits alongside Quanthome market data in the same dashboard. Portfolio figures are read beside their market context in one view instead of being reconciled across two unconnected tools, and because a generated view and a standing report sit over the same structured base, they agree.
Do generated dashboards stay current?
Yes. A generated dashboard is native to the structured data, so it refreshes as the underlying data updates rather than going stale the moment it is shared. The next time the question comes up, the view reopens on current data instead of a stale export, so each return to it is a refresh, not a rebuild.
Are sources cited in the dashboard?
Yes. Every figure in a generated dashboard carries a reference to its source, so review starts from the citation rather than a search. That traceability is what makes a generated view usable in an institutional setting, where a figure that cannot be traced to its source is a figure that cannot be signed off.
CHF 5T+ of Indexed Real-Estate Value. Your Data Beside It. Dashboards Generated in Seconds, Not Days.
Tell us the question and the data behind it. We will generate the dashboard with you in a working session.
Book a working session